

Over the years, one pattern has repeated itself in countless conversations with students, friends, and fellow market participants. The faces have changed. The circumstances have differed. Yet the questions have remained remarkably consistent.
“How much capital do I really need to begin trading?”
“Should I focus only on Nifty options, or should I diversify into stocks and commodities?”
“If a trade moves against me, should I average down or simply exit?”
Sometimes the questions are more nuanced.
A young professional asks whether intraday trading can realistically supplement a monthly salary.
A retiree wonders how much of a ₹10 lakh retirement corpus can reasonably be allocated to market participation without compromising long-term financial security.
A beginner, overwhelmed by the endless stream of online information, quietly asks the most honest question of all:
“Where do I even begin?”
None of these questions are foolish.
They are deeply human.
They reveal what beginners genuinely worry about—not indicators or chart patterns, but uncertainty. The possibility of loss. The fear of making expensive mistakes. The anxiety of missing opportunities. The confusion created by conflicting opinions.
Behind almost every technical question about stop-losses, lot sizes or chart timeframes lies a far more personal question:
“Am I approaching this the right way?”
That question deserves more than a quick answer.
It deserves perspective.
In India, access to financial markets has never been easier.
Opening a trading account with a registered broker now takes hours rather than weeks. Real-time market data is readily available. Educational content is everywhere. Mobile applications allow participation from almost anywhere.
Yet while access has become simpler, understanding has not.
A trading account can be opened in a day.
Clarity cannot.
It develops gradually through observation, reflection and disciplined experience.
This distinction explains why many beginners struggle despite having more information than ever before.
Information alone rarely creates judgement.
Beginners usually search for answers.
Experienced traders search for clarity.
The difference is subtle, yet profound.
An answer is static. It responds to a specific question at a specific moment.
“Trade this instrument.”
“Use this timeframe.”
“Risk this percentage.”
Such guidance may appear helpful, but markets are dynamic systems. Volatility expands and contracts. Liquidity changes. Economic conditions evolve. Market participants adapt.
A rule that proves useful today may become less effective under different conditions tomorrow.
Clarity behaves differently.
Rather than providing fixed instructions, it develops the ability to evaluate changing circumstances.
It allows a trader to recognise whether today’s market resembles last month’s environment.
It helps determine whether available capital is appropriate for the level of risk involved.
Most importantly, it develops the confidence to remain patient when conditions are unfavourable rather than feeling compelled to participate simply because markets are open.
Without perspective, answers become rigid rules applied mechanically.
With perspective, decisions become contextual.
Confusion, by contrast, quietly creates inconsistency.
One week, a trader follows a moving-average crossover.
The following week, the same trader abandons that method after reading a social media post promoting a completely different approach.
Risk limits expand after a few profitable trades.
Trading frequency increases during volatile sessions.
Rules gradually become optional.
The result is rarely stability.
Capital does not erode solely because markets move unpredictably.
It erodes because behaviour slowly drifts away from structure.
Behavioural inconsistency often causes more long-term damage than market volatility itself.
This article does not attempt to provide universal answers.
Markets do not reward memorised responses.
Instead, what follows is a structured framework—a way of thinking about markets, capital, strategy, time and behaviour so that decisions emerge from deliberate reasoning rather than emotional impulse.
True clarity is not the absence of uncertainty.
It is the presence of structure.
Over the years, I have observed many intelligent people enter the markets with genuine enthusiasm but without a coherent framework.
One trader moved rapidly from equities to options and then to commodities, convinced that changing instruments would somehow solve previous losses.
Another increased trading frequency after watching every movement in Bank Nifty, mistaking constant activity for genuine opportunity.
A third repeatedly averaged down into losing positions, believing lower prices automatically represented better value.
None of them lacked intelligence.
They lacked structure.
As losses accumulated, curiosity gradually gave way to frustration.
Instead of reviewing position sizing, they searched for another indicator.
Instead of examining behavioural mistakes, they blamed volatility.
Many eventually walked away—not because markets were impossible to understand, but because their approach lacked consistency.
Confusion extracts a price beyond financial loss.
It weakens confidence.
It distorts self-belief.
It creates the illusion that markets are working against the individual rather than operating according to probabilities.
A structured framework could have changed those journeys.
And perhaps it can influence yours as well.
This guide has therefore been organised deliberately into five connected parts, with each building upon the previous one.
Part I: Clarity About Markets explores what financial markets are—and equally important, what they are not. We examine market structure, volatility, participation and the realities of price movement within Indian markets.
Part II: Clarity About Capital focuses on allocation, risk exposure, drawdowns and sustainability. Capital is more than money available for trading; it determines how long the learning process can continue.
Part III: Clarity About Strategy examines how strategies are developed, evaluated and refined. It distinguishes structured decision-making from emotional reaction.
Part IV: Clarity About Time explores timeframe selection, patience and the relationship between market rhythm and personal availability.
Part V: Clarity About Yourself brings the discussion inward. Discipline, emotional stability, self-awareness and behavioural consistency ultimately determine whether any framework can be applied successfully over time.
These five parts are designed to work together.
Reading them sequentially will provide the strongest continuity, although readers may revisit individual sections whenever they become most relevant to their stage of development.
There is no urgency here.
This is not an article to skim between trading sessions.
It is intended to be studied, reflected upon and revisited over time.
Often, the greatest value comes not from reading quickly, but from pausing, making notes and allowing ideas to mature through observation.
The market will still be there tomorrow.
Understanding deserves patience.
Before moving further, it is equally important to clarify what this guide is not.
It is not a collection of stock tips or trading calls.
It does not promise guaranteed profits or fixed monthly returns.
It does not offer shortcuts to wealth creation.
Financial markets involve uncertainty. Losses are an inevitable part of participation. No framework can eliminate risk; it can only help you understand it, prepare for it, and manage it more responsibly.
Equally, this guide does not replace personal responsibility.
Experience—both profitable and unprofitable—remains one of the most valuable teachers a trader will ever encounter. Frameworks provide direction, but execution always belongs to the individual.
If you approach these pages expecting certainty or prediction, you may leave disappointed.
If you approach them seeking perspective, discipline and a more structured way of thinking, you are likely to discover something far more valuable.
The purpose of this guide is educational.
After nearly two decades of observing Indian financial markets, one conclusion has become increasingly clear.
Long-term participation depends far less on discovering secret techniques than it does on developing disciplined coherence.
The traders who endure are rarely the loudest.
They are rarely the most active.
More often, they are the most structured.
They understand that preserving capital matters before growing it.
They recognise that consistency matters before intensity.
Above all, they appreciate that disciplined decision-making ultimately matters more than occasional brilliance.
Several ideas have continued to shape my own thinking throughout this journey.
“The market does not demand brilliance. It demands coherence.”
“Capital is preserved not by excitement, but by restraint.”
“Understanding reduces noise long before it increases profit.”
These principles are simple.
Applying them consistently is not.
If you are willing to learn patiently, observe honestly, question your assumptions, and apply ideas deliberately rather than impulsively, I hope this guide becomes more than something you read.
I hope it becomes something you return to.
The conclusions you eventually reach may not be identical to mine.
They should not be.
Every trader brings different experiences, financial circumstances, risk tolerance and temperament to the market.
True conviction cannot be borrowed.
It must be earned through personal observation and disciplined experience.
That is why this guide is not designed to tell you what to think.
It is designed to help you think more clearly.
Because in trading, borrowed conviction is fragile.
Personal clarity is durable.
Let us begin by understanding the environment in which every trading decision is made.
The journey starts not with indicators or strategies, but with the market itself.
Table of Contents
- How to Read This Article
- Part 1 Clarity About Markets
- Part 2 Clarity About Capital
- Part 3
Clarity About Strategy
- The Paradox of Choice Why More Indicators Mean Less Clarity
- Reading Raw Price Action
- The Myth of the Perfect Entry
- Why One Lot Is Rarely Enough in Intraday And How to Chase the Full Rally
- Beyond Default Settings Finding Your Own Edge
- Why Averaging Down Is Averaging Up Losses
- Key Takeaways — Part III: Clarity About Strategy
- Part 4 Clarity About Time
- Part 5 Clarity About Yourself
- Conclusion The Journey Is Yours to Walk
- Disclaimer
How to Read This Article
This is not a typical blog post.
It is a comprehensive 25,000-word blueprint designed to be studied gradually, reflected upon thoughtfully, and revisited as your understanding evolves.
To gain the greatest value from it, consider the following approach.
1. Read Sequentially
The five parts of this guide build upon one another.
Part I provides context.
Part II establishes boundaries.
Part III develops method.
Part IV explores rhythm.
Part V strengthens perspective.
Reading them in sequence creates a stronger foundation than jumping between sections.
2. Take Notes
Keep a notebook or digital journal nearby.
Record ideas that challenge your assumptions, questions that deserve further exploration, observations from your own trading, and practical actions you wish to implement.
Writing transforms passive reading into active learning.
3. Pause Between Parts
There is no advantage in rushing.
After completing each major part, step away for a day or two.
Observe the market through the lens of what you have just learned before moving to the next section.
Reflection deepens understanding.
4. Revisit the Material Regularly
Concepts that seem straightforward today may reveal deeper meaning months later.
As your market experience grows, revisit earlier sections.
The framework is designed to evolve alongside your own development.
5. Apply What You Learn
Knowledge that is never applied creates only the illusion of competence.
After each part, identify one practical action.
It might be observing market behaviour more carefully, improving your trading journal, refining your risk management process, or reviewing your existing framework.
Small, consistent improvements produce meaningful long-term progress.
6. Study the Living Example
Later in this guide, you will find a live ₹20,000 demonstration account that applies the principles discussed throughout these pages.
Treat it as a learning resource rather than a template to copy.
Observe the process.
Study the discipline.
Develop your own judgement.
7. Be Patient With Yourself
This is not a race.
The objective is not to finish the article as quickly as possible.
The objective is to finish it with greater clarity, stronger judgement, and a more structured framework than when you began.
Take your time.
The market rewards thoughtful preparation far more often than hurried action.
Now, let us begin.
Part 1 Clarity About Markets

Every trading decision begins long before an order is placed.
It begins with understanding the environment in which that decision is made.
Many beginners devote considerable time to learning indicators, strategies and trading platforms, yet spend surprisingly little time understanding the market itself. They search for better entries before developing a clear understanding of the arena in which those entries will occur.
That sequence is often reversed.
Markets are not simply places where prices rise and fall. They are complex ecosystems shaped by participants with different objectives, time horizons, access to information and tolerance for risk. Long-term investors, institutions, hedgers, traders, algorithms and market makers all interact within the same environment, often for entirely different reasons.
Understanding that environment does not eliminate uncertainty.
It provides context.
Context transforms isolated price movements into meaningful behaviour.
Throughout this part of the guide, we will explore how different market segments behave, why choosing an appropriate trading arena matters, how market conditions influence strategy selection, and why the first ninety days of market participation should be devoted to building observation rather than chasing returns.
The objective is not to predict markets.
It is to understand them more clearly.
The Market Is Not One Thing Choosing Your Arena
Many beginners speak about “the market” as though it were a single, unified entity.
A chart is opened.
A position is taken.
Price moves.
Profit or loss follows.
On the surface, the process appears straightforward.
In reality, financial markets are far more diverse.
They are ecosystems comprising different instruments, participants and behavioural characteristics. Each segment operates according to its own rhythm, liquidity profile, volatility pattern and capital requirements.
The behaviour of Nifty 50 futures differs from that of a small-cap equity.
Currency derivatives respond to different forces than banking stocks.
Commodity markets often move according to global developments that have little connection with domestic sentiment.
Recognising these differences is one of the earliest forms of market clarity.
Without that understanding, many beginners drift continuously from one instrument to another, confusing activity with opportunity.
Why "Trade Everything" Is One of the Biggest Beginner Traps
The temptation is understandable.
If Nifty appears quiet, perhaps Bank Nifty will offer movement.
If equities slow down, perhaps crude oil or gold will present better opportunities.
More instruments appear to mean more possibilities.
In practice, they usually create divided attention.
Every instrument demands its own understanding.
Each has unique volatility characteristics, liquidity conditions, margin requirements, trading hours and behavioural tendencies.
Trying to follow everything often results in understanding nothing particularly well.
Professional traders frequently specialise.
Not because they lack curiosity, but because depth produces better judgement than breadth.
Over time they become familiar with how a particular instrument behaves during expiry week, how it reacts to important economic announcements, where liquidity typically increases or fades, and how volatility changes under different market conditions.
That familiarity cannot be developed by constantly switching focus.
Clarity begins by choosing an arena before attempting to master it.
Understanding the Indian Market Landscape
Indian financial markets provide several distinct arenas for participation.
Each offers different opportunities, challenges and learning curves.
Selecting an instrument should therefore be a deliberate decision rather than a random preference.
Nifty 50
The Nifty 50 represents fifty of India’s largest listed companies and serves as one of the country’s primary benchmark indices.
Its greatest strengths are liquidity and efficiency.
Bid–ask spreads are generally narrow, execution quality is relatively consistent, and participation ranges from retail traders to domestic institutions and global funds.
Compared with more specialised indices, volatility is often more measured, although significant macroeconomic events, policy announcements and global developments can still produce substantial price movement.
For many traders with modest capital, Nifty offers a structured environment in which broader market behaviour is often more important than company-specific news.
That does not make it low risk.
It simply means the nature of the risk is different.
Bank Nifty
Bank Nifty represents India’s major banking institutions and is structurally more volatile than the broader Nifty 50 index.
Intraday ranges can expand rapidly.
Momentum frequently accelerates during expiry sessions.
This attracts traders seeking larger price movement.
It also magnifies mistakes.
Larger volatility demands greater discipline in position sizing, stronger emotional control and a clearer understanding of risk.
Bank Nifty often rewards preparation.
It rarely rewards impulsiveness.
Fin Nifty
Fin Nifty broadens exposure across the financial services sector by including insurance companies, housing finance businesses, asset managers and other financial institutions alongside banks.
Its behaviour differs from both Nifty 50 and Bank Nifty.
Liquidity is generally lower.
Price movement often reflects the interaction of several financial sub-sectors rather than banking alone.
For this reason, Fin Nifty is usually better suited to traders who already understand index behaviour rather than those taking their first steps in derivatives.
Mid-cap and Small-cap Shares
Mid-cap and small-cap companies often attract investors seeking higher growth potential.
Greater opportunity, however, is usually accompanied by greater uncertainty.
Liquidity may vary considerably.
Price gaps can be significant.
Quarterly results, management announcements or sector developments may trigger large movements in either direction.
These markets reward careful preparation and disciplined risk management.
They can also expose inexperienced traders to unexpected volatility.
Commodities – Gold, Silver and Crude Oil
Commodity markets operate within a different environment.
Gold, silver and crude oil respond primarily to global developments, including inflation expectations, geopolitical events, currency movements, central bank policy and international supply dynamics.
Trading hours extend beyond the regular equity session, increasing exposure to overnight developments.
Volatility—particularly in crude oil and silver—can be substantial.
Participants include not only traders but also manufacturers, exporters, importers and commercial hedgers whose objectives differ significantly from speculative market participants.
Understanding that broader context becomes essential.
Currency Derivatives
Currency contracts such as USD/INR respond to macroeconomic variables including interest rates, inflation expectations, trade balances and monetary policy.
Although price movement may appear less dramatic than equity indices, leverage can significantly amplify exposure.
Currency markets also spend extended periods moving within relatively narrow ranges before responding sharply to major policy or economic developments.
Patience therefore becomes an important characteristic when trading currencies.
Every one of these market segments offers opportunity.
Every one also presents risk.
The objective is not to find the best market.
It is to identify the market that best aligns with your knowledge, capital, temperament and objectives.
Alignment produces consistency.
Comparison rarely does.
Your Background Can Become an Advantage
One factor that beginners frequently overlook is their own experience outside the markets.
Professional and educational backgrounds often shape how individuals naturally interpret information.
A civil engineer, for example, may instinctively understand developments affecting infrastructure, cement or steel businesses because those industries already form part of everyday experience.
A commerce graduate may feel more comfortable interpreting banking or financial-sector developments because accounting concepts and financial statements are already familiar.
Someone with an economics background may naturally connect inflation data, central bank policy or currency movements with broader macroeconomic cycles.
This does not mean traders should restrict themselves exclusively to industries they already understand.
It simply illustrates an important principle.
Your existing knowledge can become an advantage when applied thoughtfully.
Edge is rarely mysterious.
More often, it is contextual.
“The market rewards understanding more consistently than excitement.”
Matching the Instrument to Your Capital
Choosing an instrument also requires honest assessment of available capital.
Nifty derivatives often require comparatively lower margins than higher-volatility contracts.
Bank Nifty and many commodity contracts generally demand larger financial buffers because normal price fluctuations are greater.
A mismatch between capital and instrument creates unnecessary pressure.
Every fluctuation begins to feel emotionally significant.
Every trade carries excessive importance.
Ambition without capital alignment rarely produces confidence.
It usually produces stress.
Choosing your arena is therefore not a question of prestige.
It is a question of sustainability.
Selecting an instrument that aligns with your knowledge, financial resources and emotional temperament provides a far stronger foundation than constantly searching for where the next exciting opportunity might appear.
Because before learning how to trade, every trader must first decide where they truly belong.
Styles Are Not Identities They Are Responses to Conditions
One of the most common statements made by new traders sounds confident:
“I am an intraday trader.”
Or:
“I only trade options.”
At first glance, these declarations appear to reflect discipline and specialisation.
In reality, they often reveal something else—a tendency to identify with a particular trading style rather than with the market conditions that make that style appropriate.
Markets do not recognise labels.
They respond only to changing conditions.
Volatility expands and contracts.
Liquidity increases and fades.
Strong trends eventually transition into consolidation, and periods of quiet trading can suddenly become highly volatile.
When traders attach their identity to a single style, adaptability begins to decline.
An intraday strategy that performs well during high-volatility sessions may struggle when markets become quiet.
A range-based approach may repeatedly fail once a strong directional trend develops.
The market has not become “wrong”.
The environment has changed.
The trader has not.
Professional traders rarely ask:
“Which style do I prefer?”
Instead, they ask:
“Which approach best matches the market I am looking at today?”
That distinction separates identity from judgement.
Style should always remain flexible.
It is a response to conditions—not a permanent identity.
“Adaptability sustains participation. Rigidity accelerates exit.”
Intraday Trading – Understanding Its Strengths and Limitations
Intraday trading involves opening and closing positions within the same trading session.
No positions are carried overnight.
The attraction is obvious.
Capital remains active.
Risk from overnight news is avoided.
Opportunities appear almost every trading day.
Yet intraday trading also demands something many beginners underestimate:
Sustained concentration.
Every decision must be made within relatively short periods of time. Price moves quickly. Emotional reactions can develop just as quickly.
Under favourable conditions, intraday trading can be highly structured.
Sessions characterised by healthy liquidity, clearly defined price levels and moderate directional movement often provide opportunities for disciplined execution.
Certain expiry sessions in index derivatives may also produce well-defined intraday movements when approached with appropriate preparation.
The same approach becomes considerably more challenging when market conditions deteriorate.
Low-volatility sessions frequently produce false breakouts.
Unexpected news can create rapid directional moves that leave little opportunity to reassess positions.
Periods of indecision encourage overtrading as traders mistake activity for opportunity.
Intraday trading therefore rewards preparation far more than speed.
It is neither inherently superior nor inherently inferior to any other style.
Its effectiveness depends entirely on whether current market conditions support it.
Options Trading – One Market, Many Approaches
Options trading is often discussed as though it were a single strategy.
In reality, it is a broad family of approaches, each designed for different market conditions and different risk objectives.
Understanding that distinction is essential.
Options Buying
Options buyers generally benefit when price moves decisively in the anticipated direction and volatility expands.
The attraction lies in limited downside for the premium paid and the possibility of significant percentage gains when conditions align.
However, options buyers also face time decay.
Every passing day reduces the value of the option if meaningful price movement fails to occur.
Direction alone is not enough.
Timing matters.
Options Selling
Options selling operates differently.
Here, the passage of time often works in the trader’s favour.
When markets remain range-bound or implied volatility gradually contracts, option premiums naturally decay.
This potential advantage comes with greater responsibility.
Certain option-selling strategies involve substantial risk if positions are not managed carefully.
Margin requirements are also significantly higher than for many option-buying strategies.
Risk management therefore becomes central rather than optional.
Hedging
Options are also widely used for protection rather than speculation.
Investors holding long-term equity portfolios may purchase protective options to reduce downside exposure during uncertain periods.
In this context, the objective is not to maximise profit.
It is to manage risk.
Whatever the approach, one principle remains constant.
Options increase both opportunity and complexity.
A sound understanding of implied volatility, liquidity, pricing behaviour and risk exposure becomes increasingly important as participation grows.
“Leverage amplifies behaviour long before it amplifies returns.”
Swing Trading – Capturing the Middle of the Move
Swing trading occupies the space between intraday trading and long-term investing.
Positions are generally held for several days or weeks, with the objective of participating in intermediate price movements within a broader trend.
This style often suits individuals who cannot monitor markets continuously throughout the trading day but can review charts consistently outside market hours.
Trending markets frequently provide favourable conditions for swing trading.
Higher highs and higher lows during an established uptrend—or lower highs and lower lows during a downtrend—create opportunities to participate in sustained directional movement.
Unlike intraday trading, however, positions remain exposed to overnight developments.
Corporate announcements, economic events or global market movements may result in opening gaps beyond the previous day’s closing price.
Swing trading therefore exchanges continuous monitoring for overnight uncertainty.
Patience becomes one of its greatest strengths.
Traders learn to allow market structure to develop rather than reacting to every short-term fluctuation.
“Patience is not passive. It is disciplined restraint.”
Positional Trading – Thinking in Market Cycles
Positional trading extends the investment horizon further, with positions often held for several weeks or even months.
Rather than focusing primarily on short-term price fluctuations, positional traders seek to participate in broader structural trends supported by economic, sectoral or long-term technical developments.
This style generally demands greater tolerance for temporary drawdowns.
Markets rarely move in straight lines.
Even healthy long-term trends experience corrections before continuing.
Patience alone, however, is not enough.
Holding indefinitely without periodic review is not positional trading.
It is neglect.
Successful positional participation requires ongoing reassessment of both market structure and the original reasons for entering the trade.
Longer holding periods do not eliminate risk.
They simply redistribute it across time.
“A longer timeframe changes the nature of risk. It does not remove it.”
Each of these approaches serves a purpose.
None is universally superior.
Each performs well under some market conditions and struggles under others.
The objective is therefore not to discover the “best” trading style.
It is to recognise which style aligns most closely with the market environment currently in front of you.
That judgement begins with understanding the condition of the market itself.
Before choosing a style, experienced traders first diagnose the environment in which that style will be applied.
Diagnosing Market Conditions – A Practical Lens
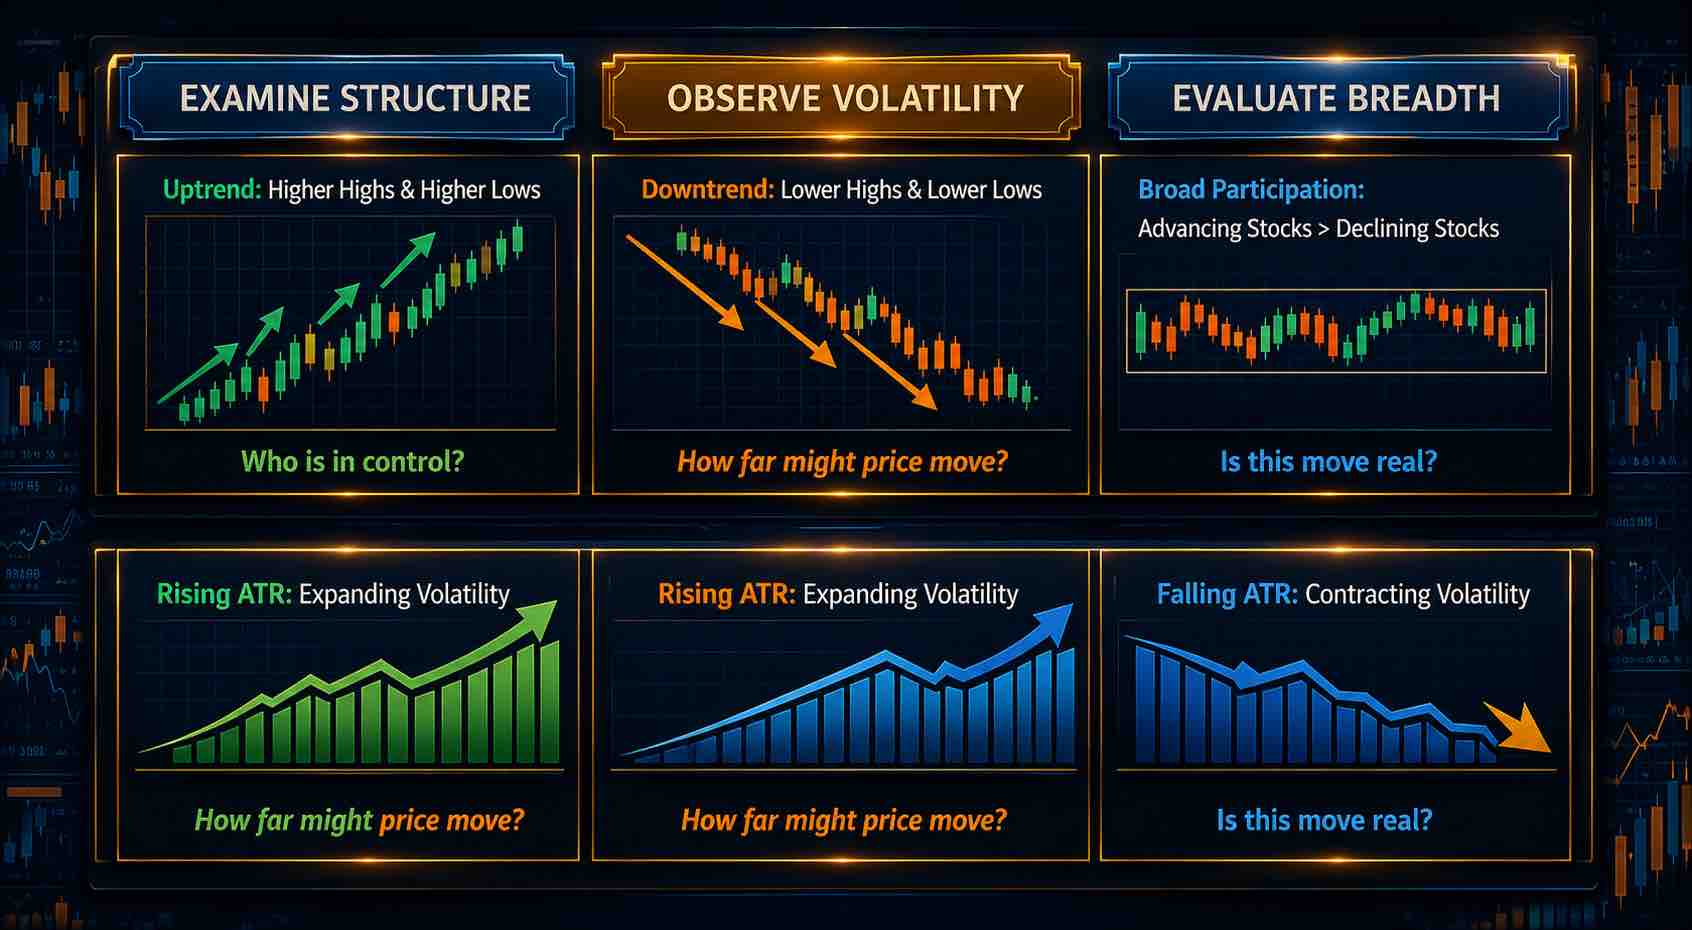
A simple framework for diagnosing market conditions using structure, volatility, and market breadth before selecting a trading approach.
Clarity improves when conditions are assessed before style selection.
Many traders open charts and immediately look for trades. Professionals first look for context. They ask: what kind of market is present today?
This diagnosis takes minutes. It saves weeks of frustration.
First, examine structure.
Structure reveals the market’s underlying rhythm. Pull up a daily or hourly chart of Nifty, Bank Nifty, or the instrument you trade. Look at the sequence of highs and lows.
Are highs and lows rising consistently?
That suggests an uptrend. Buyers remain in control. Pullbacks may offer opportunities in the direction of trend.
Are highs and lows declining?
That signals a downtrend. Sellers dominate. Short-side setups or defensive positioning may align with conditions.
Are highs and lows alternating within a defined band?
That indicates a range. Support and resistance become relevant. Mean-reversion strategies often suit such environments.
Structure answers the question: who is in control?
The 90-Day Market Test Your First Quarter
The first ninety days in the market shape habits far more than they shape financial results.
During this period, the objective is not to generate impressive returns. It is to develop observation, discipline and self-awareness while limiting unnecessary financial exposure.
A structured beginning creates a stronger foundation than an aggressive one.
Rather than measuring success by profit, measure it by the quality of your decisions and the consistency of your process.
Weeks 1–4: Observe Before You Participate
The first month is best devoted entirely to observation.
Choose one primary instrument—such as the Nifty 50—and two or three actively traded stocks. Watch them every trading day without placing a single trade.
Observe how the market opens.
Notice whether price frequently reverses after the first thirty minutes or whether momentum continues throughout the session.
Pay attention to how volatility changes during different times of the day and how markets respond to domestic announcements, global developments and economic events.
Maintain a dedicated journal throughout this period.
Record recurring price behaviour.
Write down questions that arise.
Document areas of confusion.
At this stage, there is no pressure to perform.
There are no positions to manage.
There is only observation.
Learning to see clearly is the first step towards learning to trade well.
Success during Month One is simple: being able to describe market behaviour accurately and consistently.
Weeks 5–8: Learn Through Paper Trading
The second month introduces structured simulation.
Begin recording hypothetical trades based on clearly defined rules.
Document your planned entry, stop-loss, target and reasoning exactly as though real capital were involved.
Use this phase to become comfortable with your trading platform, order types and execution process.
Pay attention to practical details such as slippage, liquidity and realistic order fills rather than assuming every trade would execute perfectly.
Paper trading has one obvious limitation.
It removes emotional pressure.
Losses do not hurt.
Profits do not tempt.
For that reason, it should never be mistaken for live trading.
However, when approached seriously—and reviewed honestly each week—it develops procedural familiarity before real money is placed at risk.
Success during Month Two lies in executing the plan consistently, not in producing hypothetical profits
Weeks 9–12: Introduce Small Live Positions
Only during the third month should limited live participation begin.
The amount committed should be small enough that losing it completely would not affect your financial stability or emotional wellbeing.
At this stage, capital is not being used to generate income.
It is being used to understand behaviour.
Every trade becomes an opportunity to observe yourself.
Did you follow your written plan?
Did fear influence your exit?
Did impatience encourage an early entry?
Did confidence tempt you to ignore your own rules?
Alongside every trade, record your emotional state.
Anxiety.
Overconfidence.
Frustration.
Relief.
These observations often reveal more about long-term success than the trade itself.
Ignore the size of the profit or loss.
Focus instead on the quality of execution.
Success during Month Three is measured by behavioural consistency under real market conditions.
“Early discipline compounds quietly, but its rewards often last for years.”
Measuring Success After Ninety Days
At the end of the first quarter, something important begins to change.
Markets feel less mysterious.
Price structure becomes easier to recognise.
Different trading styles begin to make sense within different market conditions.
Most importantly, your own behavioural patterns become visible.
You begin to understand not only how markets behave, but also how you behave within them.
Profit may have appeared.
It may not.
Neither outcome determines whether the first ninety days have been successful.
The true measure is whether you have developed a more structured way of observing, thinking and acting.
Behavioural clarity is a far stronger foundation than early profitability.
With a clearer understanding of markets now established, the next question naturally follows:
How should capital be allocated so that learning can continue sustainably?
That is the focus of Part II — Clarity About Capital.
Key Takeaways — Part I: Clarity About Markets
- Markets are not one thing. Choose an arena that matches your knowledge, capital and temperament.
- Trading styles are responses to conditions, not identities. Adapt as markets change.
- Diagnose structure, volatility and breadth before choosing a strategy.
- The first 90 days should build observation and discipline — not profit.
Part 2 Clarity About Capital
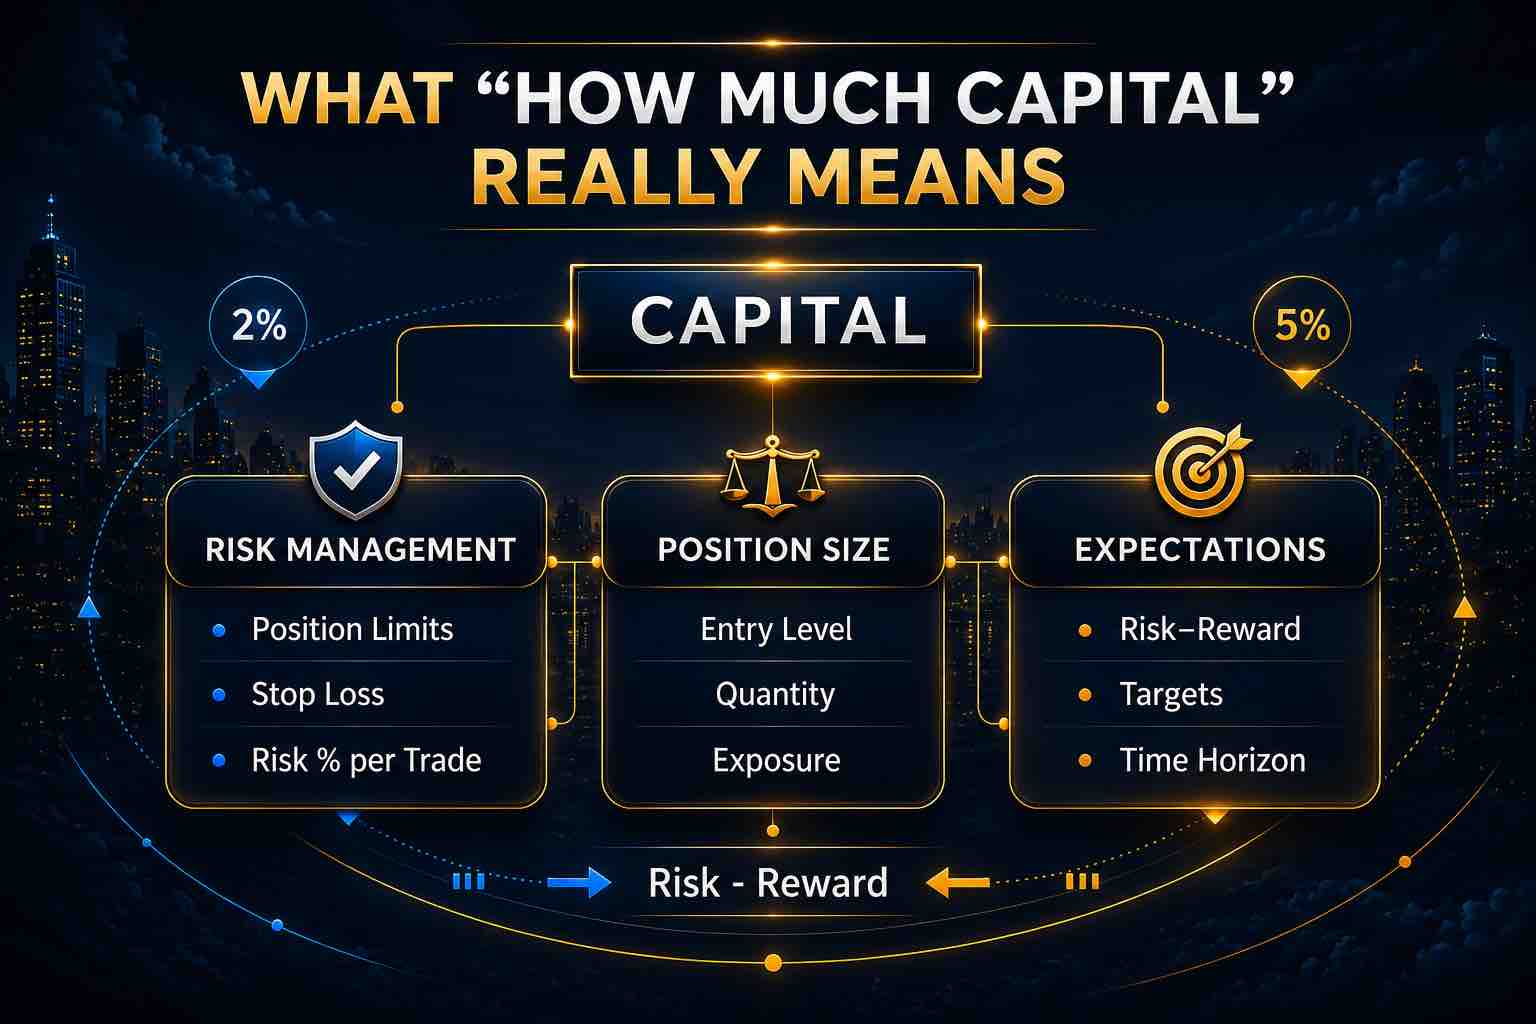
Markets cannot be approached with conviction if capital itself remains misunderstood.
Many beginners spend months searching for better indicators, more accurate strategies, or higher-probability setups. Yet relatively few pause to examine the very resource that makes market participation possible in the first place.
Capital.
It appears simple.
It is anything but.
Capital determines how long you can remain in the market, how comfortably you can absorb uncertainty, and how objectively you can make decisions when prices move against you.
Two traders may follow the same strategy with identical technical knowledge.
One survives.
The other disappears.
Often, the difference lies not in analytical ability, but in how capital was understood before the first trade was ever placed.
This chapter therefore shifts attention away from charts and towards the foundation that supports every trading decision.
Not simply how much capital you possess.
But what that capital actually represents.
What "How Much Capital" Really Means
Capital is usually discussed in numbers.
₹50,000.
₹1 lakh.
₹5 lakhs.
₹5 crores.
Conversations about trading often begin there.
Yet the question that repeatedly surfaces—
“How much capital do I really need?”
—rarely concerns arithmetic alone.
Behind it sits something far more personal.
Anxiety.
Ambition.
Comparison.
Hope.
The question appears straightforward.
How much is enough?
The deeper question is rarely spoken aloud.
How much can I genuinely afford to lose without destabilising my life?
That distinction changes everything.
Capital is not merely the amount deposited into a brokerage account.
It performs three roles simultaneously.
It funds participation.
It absorbs inevitable losses.
It reflects your emotional relationship with money.
Most beginners recognise only the first.
Experienced traders think constantly about the second and the third.
Capital functions as a learning budget.
It provides emotional runway.
It creates the psychological space required to make rational decisions during uncertain conditions.
Too little capital may restrict flexibility.
Too much capital may magnify fear.
Neither extreme serves the learning process.
The appropriate amount is rarely determined by aspiration.
It is determined by tolerance.
Understanding what capital truly represents changes not only how trading begins—
but whether it continues long enough for genuine skill to develop.
The ₹5,000 Experiment — Learning Execution
Consider beginning with ₹5,000.
From a financial perspective, this amount is unlikely to transform your life.
It will not generate extraordinary wealth.
It cannot reasonably be expected to produce meaningful compounding within a short period.
Yet its educational value can be remarkably high.
Even a small trading account introduces realities that no textbook can fully explain.
Orders behave differently under live market conditions.
Limit orders and market orders produce different outcomes.
Bid–ask spreads widen during periods of volatility.
Slippage appears.
Brokerage charges become visible.
Liquidity suddenly matters.
Knowledge that once felt theoretical becomes operational.
The trader begins learning how markets actually function rather than how they are described.
Equally important, emotional pressure usually remains manageable.
A twenty percent decline represents ₹1,000.
The loss may disappoint.
It rarely threatens financial stability.
That distinction matters.
At this stage, the market is teaching execution.
Not psychology.
The objective is to understand mechanics before money begins influencing behaviour.
The ₹50,000 Experiment — Learning Emotion
Now consider a different starting point.
₹50,000.
For one individual, this may represent discretionary savings.
For another, it may equal several months of disciplined saving.
Context determines emotional significance.
At this level, the market begins teaching something entirely different.
Emotion.
A ₹5,000 drawdown no longer feels theoretical.
It may represent household expenses.
A family outing.
Part of an EMI.
Gains also become emotionally amplified.
One profitable week can quietly create overconfidence.
One losing week can trigger unnecessary caution.
Patterns begin emerging.
Some traders reduce position size after the first meaningful loss.
Others attempt immediate recovery.
A few increase exposure prematurely after early success.
The market now acts as a mirror.
Journalling becomes considerably more valuable.
Questions naturally arise.
Did I follow my written plan?
Did fear influence my exit?
Did greed delay profit-taking?
Was this trade genuinely structured—or emotionally driven?
The answers reveal something deeper than trading performance.
They reveal your relationship with risk.
Capital at this level no longer teaches mechanics.
It begins teaching behaviour.
Bearable Capital — A Personal Framework
Rather than asking,
“How much capital is required to succeed?”
consider asking a different question.
How much capital can I genuinely afford to lose without disrupting my life?
This perspective shifts attention away from ambition and towards sustainability.
Three questions provide useful guidance.
1. If this capital disappeared tomorrow, would my daily life be affected?
Would rent become difficult?
Would EMI payments become stressful?
Would essential family responsibilities be compromised?
If the answer is yes, the amount is probably too large.
Trading capital should never compete with essential living expenses.
2. If this capital were lost entirely, how long would it take to regain emotional balance?
Would frustration dominate your thinking?
Would revenge trading become tempting?
Would confidence disappear completely?
Markets test temperament before they reward skill.
Emotional resilience deserves as much attention as financial resilience.
3. If necessary, could this capital be rebuilt within three to six months through your primary source of income?
If replacing it would require years of recovery, every trading decision will carry disproportionate emotional pressure.
Pressure narrows judgement.
Clarity requires breathing room.
Bearable capital therefore differs for every individual.
₹50,000 may represent a manageable educational expense for one trader.
For another, it may represent unacceptable financial vulnerability.
Comparison becomes irrelevant.
Honesty becomes essential.
“The right capital is rarely the largest amount available.
It is the largest amount that allows disciplined decision-making without emotional distortion.”
Trading demands room for error.
Your capital should provide that room.
The Early Age Advantage — Compounding Learning
Young traders often underestimate their greatest advantage.
Time.
Beginning early with modest capital creates something far more valuable than rapid financial growth.
It creates years of observation.
Bull markets.
Bear markets.
Corrections.
Recoveries.
Periods of optimism.
Periods of fear.
Experiencing these cycles firsthand develops market intuition that cannot be purchased later.
Losses at twenty-five rarely carry the same long-term consequences as equivalent losses at fifty-five.
Time absorbs mistakes.
Experience compounds.
During the early years, wealth should not be the primary objective.
Learning should.
Financial compounding follows behavioural compounding.
Every disciplined journal entry.
Every reviewed mistake.
Every improved decision.
Gradually strengthens judgement.
Judgement protects capital.
Protected capital creates longevity.
“Wisdom compounds more reliably than profit.”
That may be the most valuable investment available to any beginner.
Two Contrasting Journeys
Over the years, I have observed traders begin their journeys with vastly different amounts of capital.
Interestingly, the size of the starting capital rarely determined the outcome.
Their approach did.
One trader entered the market with approximately ₹5 lakhs.
He was intelligent, enthusiastic, and eager to accelerate his progress. Confident in his ability to recover from setbacks, he allocated aggressively to highly volatile instruments almost immediately.
Within three months, his account experienced a drawdown of nearly 40%.
The financial loss was significant.
The psychological impact proved even greater.
Confidence disappeared.
Every subsequent decision became hesitant.
Instead of reviewing his process, he withdrew from the market entirely.
Several years passed before he felt comfortable returning.
His capital had been sufficient.
His psychological buffer had not.
Now consider another trader.
He began with just ₹5,000.
Progress was slow.
Trades were intentionally small.
Every position was documented.
Every mistake was reviewed.
Profits remained modest.
Losses remained manageable.
More importantly, confidence grew gradually rather than dramatically.
As experience accumulated, position sizes increased naturally alongside competence.
Years later, that measured beginning proved to be a powerful advantage.
The difference was never the starting amount.
It was the relationship each trader developed with risk.
Large beginnings do not guarantee longevity.
Measured beginnings often encourage it.
The Expectation Trap — What Profit Really Looks Like
Expectations quietly influence behaviour long before the first trade is placed.
If the mind expects extraordinary returns within a few months, patience gradually disappears.
Every ordinary result feels disappointing.
Every temporary drawdown feels unacceptable.
Frustration begins replacing discipline.
Eventually, frustration searches for shortcuts.
The market rarely rewards that search.
Realistic expectations create something far more valuable.
Stability.
Financial markets undoubtedly offer opportunities beyond many traditional investment alternatives.
However, those opportunities arrive together with uncertainty, effort, emotional pressure, and the possibility of loss.
Higher potential returns never exist independently of higher responsibility.
Perspective therefore becomes essential.
The objective is not simply to earn more.
It is to understand what those additional returns actually require.
Fixed Deposits and Market Participation
Consider a traditional bank fixed deposit.
In India, such deposits may offer approximately five to six percent annually.
The capital remains comparatively secure.
Effort is minimal.
Emotional volatility is almost nonexistent.
Market participation operates very differently.
Potential returns may indeed exceed those available through fixed deposits.
But certainty disappears.
Markets require preparation.
Study.
Observation.
Emotional discipline.
Continuous review.
Drawdowns become possible.
Performance fluctuates.
The comparison should never be framed as one option being universally superior.
Instead, it should focus on opportunity cost.
If active market participation, over an extended period, fails to compensate for the additional effort, uncertainty, and emotional commitment it demands, reflection becomes necessary.
Clarity replaces unrealistic comparison.
The market owes no trader extraordinary returns simply because greater effort has been invested.
It rewards disciplined execution.
Not expectation.
The 10–15% Monthly Illusion
Few ideas spread more rapidly among new traders than the belief that consistent monthly returns of ten to fifteen percent are normal.
The mathematics certainly appears attractive.
Starting with ₹1,00,000:
At 10% monthly, capital grows to approximately ₹1,10,000 after one month.
₹1,21,000 after two months.
More than ₹3,13,000 after one year.
At 15% monthly, the numbers become even more dramatic.
The power of compounding appears extraordinary.
The mathematics is correct.
The assumption is not.
Compounding itself is never the illusion.
The illusion lies in believing that such returns can be generated consistently without substantial risk.
Consider what achieving ten percent every month actually demands.
A trader managing ₹1,00,000 must generate approximately ₹10,000 of profit every single month.
Not occasionally.
Consistently.
While simultaneously avoiding significant drawdowns.
If risk per trade remains appropriately controlled, this level of consistency demands exceptional discipline, refined execution, and favourable market conditions.
Even highly experienced professionals encounter difficult periods.
Market conditions evolve.
Volatility expands and contracts.
Strategies experience periods of strength and periods of weakness.
No edge performs equally well under every circumstance.
A trader capable of producing sustained double-digit monthly returns over many years belongs to a remarkably small group globally.
Such outcomes are possible.
They are not typical.
They often involve exceptional skill, concentrated risk, unusually favourable market conditions, or strategies that become difficult to scale.
Social media rarely communicates this reality.
Screenshots of spectacular profits circulate widely.
Months of disciplined consistency receive little attention.
Losing periods rarely become public.
The visible outcome overwhelms the invisible process.
This creates dangerous expectations.
A trader earning a perfectly respectable two or three percent in a month begins believing something is wrong.
Impatience follows.
Position sizes increase.
Risk expands.
Behaviour deteriorates.
Ironically, the pursuit of extraordinary returns frequently destroys the consistency required to achieve even ordinary ones.
“Extraordinary returns demand extraordinary stability.”
Most traders are not limited by intelligence.
They are limited by ordinary human emotions.
Fear.
Greed.
Hope.
Fatigue.
Overconfidence.
Disciplined trading does not eliminate these emotions.
It teaches you to manage them.
The objective therefore should not be extraordinary monthly returns.
It should be sustainable returns aligned with your capital, your personality, and your ability to execute consistently.
When expectations become realistic, behaviour becomes calmer.
When behaviour becomes calmer, survival becomes far more likely.
The 100–500% Narratives
Stories of extraordinary market success circulate constantly.
A trader turns a few lakhs into several crores.
An options position multiplies tenfold within days.
A portfolio records gains of several hundred percent within a single year.
These stories are compelling.
They are also incomplete.
Successful outcomes naturally attract attention.
Unsuccessful attempts rarely do.
This creates survivorship bias.
The market quietly forgets the thousands of traders who attempted the same approach but experienced very different results.
Another factor frequently remains hidden.
Risk.
Many exceptional returns are achieved by accepting equally exceptional exposure.
Large position sizes.
Aggressive leverage.
Highly concentrated bets.
These decisions are rarely visible in screenshots celebrating the outcome.
Neither are the emotional pressures that accompanied them.
Market cycles further distort perception.
Strong bull markets often elevate many portfolios simultaneously.
Skill and favourable conditions become difficult to separate.
Occasionally, the stories themselves are simply inaccurate.
Edited statements.
Borrowed screenshots.
Selective reporting.
Such material exists more frequently than many beginners realise.
Whenever extraordinary performance claims appear, one question provides immediate perspective.
Was the opportunity recognised before it happened—or only explained afterwards?
Anyone can describe yesterday’s market.
Very few can navigate tomorrow’s uncertainty with consistent discipline.
Outcomes alone never reveal process.
And process is ultimately what determines longevity.
“Speed captures attention. Sustainability builds wealth.”
The Power of Modest Compounding
In an age fascinated by overnight success, modest progress often appears unremarkable.
A monthly return of two or three percent rarely attracts headlines.
Few social media posts celebrate consistency.
Yet consistency quietly accomplishes something extraordinary.
It compounds.
Imagine ₹1,00,000 growing steadily at approximately 2.5% each month.
After one year, the capital approaches ₹1,34,000.
After three years, it exceeds ₹2,40,000.
After five years, it grows beyond ₹4,40,000.
Increase that monthly return modestly to 3%.
The numbers become even more meaningful.
None of these outcomes depends upon spectacular trades.
None requires predicting every market top or bottom.
None depends upon excessive leverage.
They depend upon one quality.
Consistency.
The mathematics of compounding is straightforward.
The behavioural discipline required to achieve it is not.
A trader pursuing sustainable monthly returns can maintain tighter risk controls.
Position sizes remain proportionate.
Sleep improves.
Decision-making becomes calmer.
Temporary losing periods remain manageable because survival never depends upon one exceptional trade.
By contrast, the pursuit of twenty percent monthly returns often demands increasingly aggressive behaviour.
Larger positions.
Greater leverage.
Reduced patience.
One significant loss can erase months of apparent progress.
The mathematics of compounding works in both directions.
Large drawdowns compound just as efficiently as profits.
“Consistency outweighs occasional windfalls.”
The purpose of market participation is not to create dramatic stories.
It is to create durable progress.
A bank fixed deposit offers stability with limited effort.
Market participation should, over time, justify its additional complexity—not by promising impossible returns, but by rewarding disciplined participation.
When expectations become realistic, emotional turbulence decreases.
When emotional turbulence decreases, judgement improves.
Improved judgement protects capital.
Protected capital creates longevity.
Compounding therefore influences far more than money.
It gradually transforms behaviour itself.
“Compounding rewards patience more consistently than aggression.”
The trader who understands this stops searching for the next miracle opportunity.
Instead, they focus on something far more sustainable.
Showing up.
Following the process.
Allowing time to perform the heavy lifting.
Position Sizing The Art of Enough
Capital determines whether you can participate.
Position sizing determines whether you can survive.
Two traders may identify the same opportunity.
They may enter the same instrument at the same price.
They may even use identical technical analysis.
Yet their experiences can be dramatically different.
One remains calm during normal market fluctuations.
The other becomes emotionally overwhelmed.
The difference rarely lies in the chart.
It lies in the size of the position.
Position sizing quietly influences almost every aspect of trading.
It shapes emotional pressure.
It determines financial exposure.
It controls recovery after losing trades.
More importantly, it protects longevity.
Many traders devote years to refining entries while giving comparatively little attention to position size.
Ironically, position sizing often contributes more to long-term survival than strategy selection itself.
It is the invisible architecture supporting every trading decision.
The 2% Rule — Context and Limitations
One of the most widely quoted principles in trading states that no more than two percent of total trading capital should be risked on any single trade.
The reasoning is straightforward.
Capital preservation always comes before capital growth.
When risk remains limited, a sequence of losing trades becomes survivable.
Imagine a trader risking only two percent per position.
Even ten consecutive losses would reduce capital by approximately twenty percent.
Emotionally uncomfortable?
Certainly.
Financially recoverable?
Absolutely.
The trader remains active.
Learning continues.
Opportunity remains available.
When combined with disciplined execution and meaningful stop-loss placement, this principle provides valuable protection against catastrophic drawdowns.
However, problems begin when the rule is applied mechanically rather than thoughtfully.
The first misunderstanding involves stop-loss placement.
Some traders decide they will simply place a stop exactly two percent below every entry.
But markets do not recognise percentages.
They recognise structure.
A stop positioned in the middle of ordinary market noise may be triggered repeatedly despite the original trading idea remaining valid.
The rule has been followed.
Context has not.
Consider a practical example.
A trader with ₹2,00,000 identifies a stock trading at ₹500.
A well-defined support zone exists near ₹480.
The logical structural stop therefore sits approximately ₹20 below the entry.
If the trader wishes to risk ₹4,000—representing two percent of total capital—the appropriate position becomes 200 shares.
Position size now follows market structure.
Not arbitrary percentages.
Now imagine another trader with identical capital.
He enters impulsively without identifying support.
A stop is simply placed at ₹490 because it appears to represent two percent.
Nothing about that level reflects actual market behaviour.
Routine price fluctuation may trigger the exit even though the broader trend remains intact.
The rule was respected.
The market was ignored.
That distinction matters.
Another misunderstanding concerns the relationship between trading capital and trade value.
A trader with ₹1,00,000 may enter one lot of Nifty futures, controlling a contract worth several multiples of available capital.
Applying a simple percentage rule without recognising the underlying exposure often produces unrealistically tight stops that normal market volatility can trigger repeatedly.
The challenge is no longer the percentage.
It is the relationship between exposure and structure.
“A rule followed blindly is not discipline.
It is automation.”
The real value of the two percent principle lies in the question it encourages.
How much am I genuinely prepared to lose if this idea proves incorrect?
When the answer emerges from thoughtful analysis, the rule becomes meaningful.
When it replaces analysis entirely, it loses much of its value.
Position sizing should always begin with structure.
Percentages merely help translate that structure into disciplined exposure.
5% of Trade Value — A Structural Perspective
Risk is often discussed as though it exists independently of the trade itself.
In reality, risk always exists in relation to exposure.
This distinction explains why percentage-based rules, while useful, are sometimes applied incorrectly.
Many traders calculate risk solely as a percentage of total trading capital.
The intention is sensible.
The application can become incomplete.
A more practical approach begins with a different question.
What is the total value of the position I am controlling?
Only after understanding that exposure should appropriate risk be determined.
Trade value introduces context.
Context improves judgement.
To understand why, consider three practical examples.
Example 1: Nifty Futures
Assume the following:
- Trading capital: ₹10,00,000
- Nifty Futures price: 25,000
- Lot size: 65
The contract value becomes:
65 × 25,000 = ₹16,25,000
Although the exchange margin required may be substantially lower than the contract value, the market still moves according to the full exposure of the contract.
Many traders now apply the familiar two-percent rule.
Two percent of ₹10,00,000 equals ₹20,000.
On paper, this appears disciplined.
In practice, however, it may force an unrealistically tight stop-loss if normal market volatility regularly exceeds that amount.
The stop is no longer determined by market structure.
It is determined by arithmetic.
A structural approach begins differently.
Instead of asking,
“How much of my capital should I risk?”
the trader first asks,
“Where does the market logically prove my trade wrong?”
Only after identifying that structural level should position size be adjusted to ensure the resulting financial exposure remains acceptable.
This reverses the order of thinking.
The market defines the stop.
The stop defines the position size.
Not the other way around.
That single change often improves decision quality dramatically.
Example 2: Bank Nifty Options
Now consider a Bank Nifty option.
Assume:
- Trading capital: ₹1,50,000
- Premium: ₹150
- Lot size: 15
The trade value becomes relatively modest.
However, options introduce an additional consideration.
Premiums often fluctuate rapidly.
A stop-loss that appears adequate during quiet conditions may become unrealistic once volatility expands.
Again, the quality of the entry determines whether a practical stop-loss can exist.
Buying close to a meaningful technical level naturally allows tighter risk.
Buying impulsively after an extended move rarely does.
The principle remains unchanged.
Entry quality determines stop viability.
Example 3: Swing Trading in Equities
Suppose a trader purchases 100 shares at ₹500.
The total trade value equals ₹50,000.
Rather than selecting an arbitrary stop-loss percentage, attention first turns to the chart.
Where does the original trading idea become invalid?
If meaningful support exists approximately five percent below the entry, position sizing naturally aligns with structure.
If genuine support lies considerably lower, one of two decisions becomes necessary.
Either reduce the number of shares purchased.
Or decline the trade entirely.
The chart should determine acceptable exposure.
Never the desire to force a particular position size.
“The stop defines the size.
The size never defines the stop.”
Entry Quality Determines Stop Distance
Every stop-loss ultimately reflects one simple idea.
It identifies the point where the original trading premise is no longer valid.
Nothing more.
Nothing less.
Unfortunately, many traders reverse this logic.
They decide how much they are willing to lose before examining where the market actually invalidates their analysis.
The result is predictable.
Stops become arbitrary.
Normal price movement triggers unnecessary exits.
Frustration follows.
High-quality entries naturally solve much of this problem.
Entering near well-defined support during an uptrend often permits relatively tight structural stops.
Entering close to resistance within a downtrend offers similar advantages.
Chasing momentum after a large move usually requires wider stops because the nearest meaningful structural reference lies much further away.
Structure therefore influences everything that follows.
Stop distance.
Position size.
Risk exposure.
Even emotional comfort.
The objective is never to survive poor entries by using wider stops.
The objective is to improve entry quality until realistic stop placement becomes possible.
“The goal is not to survive a bad entry.
The goal is to enter so well that survival is rarely tested.”
When entries improve, risk naturally declines.
Not because percentages changed.
Because structure improved.
Position Sizing Across Different Instruments
Although the underlying principles remain consistent, each financial instrument introduces its own practical considerations.
Equities
Risk begins with the distance between the planned entry and the structural stop-loss.
Once that distance is known, position size can be adjusted so that the maximum financial loss remains acceptable.
Simple.
Objective.
Repeatable.
Futures
Futures introduce leverage.
Even relatively small price movements can produce substantial fluctuations in account value.
Understanding point value, contract size, and total exposure therefore becomes essential before entering the trade.
Leverage magnifies outcomes.
It should never magnify misunderstanding.
Options
For option buyers, the premium paid generally represents the maximum possible loss.
Option sellers, however, assume considerably greater exposure and must understand margin requirements together with potentially unlimited risk.
Regardless of strategy, the same principle applies.
Calculate the worst-case financial outcome before entering the trade.
Never afterwards.
Preparation always precedes protection.
The Principle That Connects Everything
Capital should be bearable.
Expectations should be realistic.
Position size should follow structure.
When these three elements work together, trading becomes considerably more sustainable.
Capital provides the opportunity to participate.
Expectations prevent unnecessary pressure.
Position sizing protects longevity.
Remove any one of these foundations and even an excellent strategy begins operating on unstable ground.
Risk management therefore does not begin with stop-losses.
It begins with perspective.
Perspective shapes behaviour.
Behaviour shapes outcomes.
Capital creates the ability to participate.
It does not determine how participation should occur.
That responsibility belongs to strategy.
A trader may possess adequate capital, realistic expectations, and disciplined position sizing, yet still struggle without a coherent framework for interpreting markets and making decisions.
Capital provides the opportunity to enter the market.
Strategy determines what to do once you are there.
Without a structured method, even sufficient capital gradually becomes vulnerable to inconsistency. Decisions become reactive rather than deliberate. Confidence fluctuates with every outcome. Behaviour slowly drifts away from discipline.
The next part therefore shifts our attention from money to method.
Not towards discovering a magical indicator.
Nor towards finding the perfect entry.
Instead, it explores something far more valuable:
A coherent framework for observing markets, interpreting price, managing uncertainty, and making decisions with consistency.
Because capital allows participation.
Strategy gives that participation direction.
Key Takeaways — Part II: Clarity About Capital
- Capital is a learning budget, not just money to deploy. Bearable capital protects judgement.
- Realistic expectations (2–3% monthly) sustain discipline far longer than chasing 10–15%.
- Position size should follow market structure — the stop defines the size, never the reverse.
- Capital creates the ability to participate. Strategy decides what happens next.
Part 3 Clarity About Strategy
Capital allows participation.
Strategy determines direction.
Without clarity of method, even well-managed capital becomes vulnerable to inconsistency. A strategy is not a collection of disconnected tools or isolated techniques. It is a structured framework for interpreting price, managing risk, and responding to uncertainty.
Many traders spend years searching for a better indicator.
Few spend the same amount of time refining a better framework.
That difference shapes long-term outcomes.
In the early stages of trading, charts often resemble aircraft control panels. Moving averages are layered over oscillators. Bollinger Bands surround price. MACD histograms occupy one panel. RSI fluctuates between 30 and 70. Stochastic lines cross repeatedly beneath the chart.
The underlying assumption appears logical: more indicators should produce better confirmation. Better confirmation should produce higher probability.
In practice, the opposite often occurs.
Each additional indicator introduces another layer of interpretation—not another layer of certainty.
Clarity rarely increases with clutter.
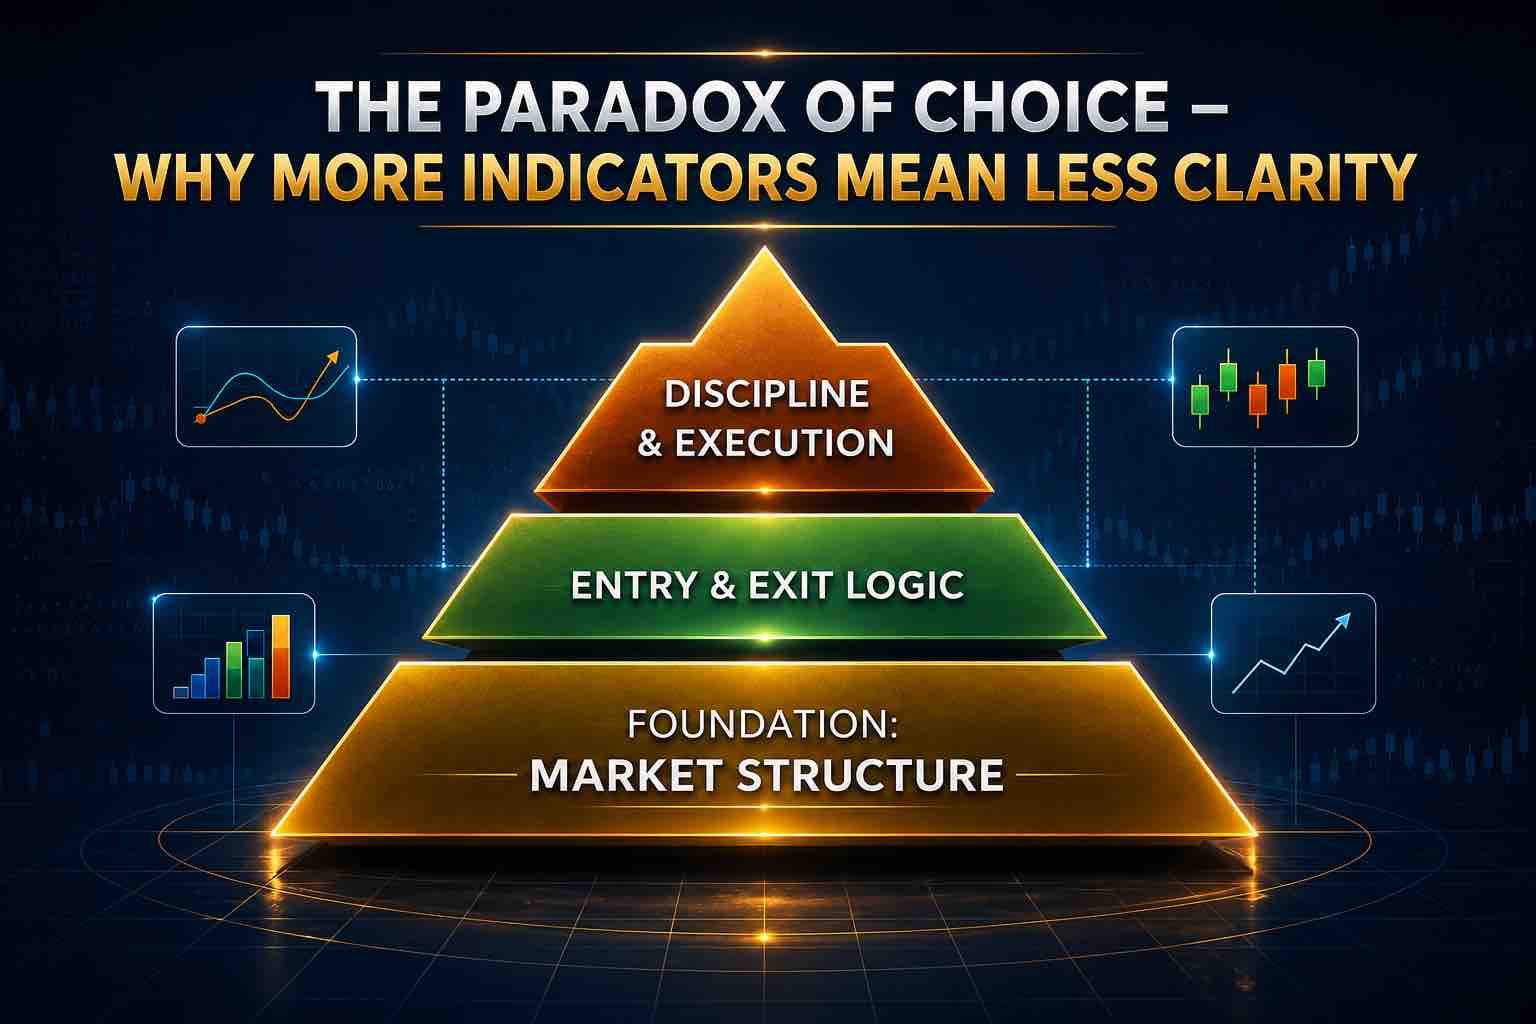
The Paradox of Choice Why More Indicators Mean Less Clarity
Modern traders enjoy access to more technical tools than any previous generation.
Charting platforms provide hundreds of indicators. New strategies appear every week. Social media promises combinations capable of identifying perfect entries, flawless exits, and exceptionally high win rates.
Choice appears to be an advantage.
Yet behavioural psychology suggests otherwise.
When too many choices compete for attention, decision quality often deteriorates. Rather than improving judgement, excessive choice creates hesitation, second-guessing, and inconsistency. What appears to be analytical depth frequently becomes cognitive overload.
Trading is no exception.
Many beginners believe their problem lies in not having enough indicators. In reality, their greatest obstacle is often an inability to distinguish what matters from what merely appears useful.
The market does not become clearer because the chart becomes more crowded.
It becomes more difficult to read.
“Complexity often disguises uncertainty. Clarity reveals it.”
Why So Many Indicators Exist
Technical indicators were never designed to confuse traders.
They emerged as practical attempts to quantify market behaviour.
Early market technicians observed recurring relationships between price and volume. They sought ways to measure trend strength, identify momentum shifts, estimate volatility, and recognise conditions where price might revert towards equilibrium. Each new indicator attempted to improve upon a limitation found in earlier methods.
Moving averages reduced visual noise by smoothing price.
Oscillators attempted to identify momentum extremes.
Volatility bands provided statistical context around price movement.
Over time, innovation accelerated.
Today, virtually every charting platform offers hundreds of technical indicators. Many are sophisticated. Many are simply variations of existing concepts.
Yet almost all of them share one characteristic.
They originate from the same underlying source.
Price.
Indicators do not create information.
They reorganise information that already exists within price.
This distinction is fundamental.
Price is the original market data.
Indicators are mathematical interpretations of that data.
Understanding this hierarchy prevents misplaced confidence.
Indicators can improve interpretation.
They cannot replace observation.
They describe price.
They do not predict it.
The Trap of Accumulation
One indicator appears useful.
Adding a second feels safer.
Adding a third seems even more convincing.
Soon the chart contains multiple moving averages, oscillators, momentum studies, volatility bands, and customised signals—all attempting to answer the same question.
Should I enter this trade?
Ironically, the additional information often produces greater uncertainty.
One indicator signals overbought conditions.
Another suggests bullish momentum.
A third indicates positive divergence.
The trader waits for complete agreement.
Perfect agreement rarely arrives.
Entries are delayed.
Opportunities are missed.
Or worse, the apparent agreement creates excessive confidence.
Three indicators appear to confirm the same conclusion.
Yet all three may simply be interpreting the identical price movement through different mathematical formulas.
Correlation quietly masquerades as confirmation.
“Indicators echo price. They do not lead it.”
As charts become increasingly crowded, almost any trading decision can be justified.
Confusion begins to resemble sophistication.
The objective of technical analysis is not to accumulate evidence indefinitely.
It is to reduce uncertainty enough to make disciplined decisions within a structured framework.
Clarity requires restraint.
Two to Three Patterns Worth Mastering
One of the most common mistakes among beginners is attempting to master every chart pattern they encounter.
Markets have produced countless names over the years—flags, wedges, triangles, diamonds, cups and handles, harmonic formations, Elliott Waves, Wolfe Waves, and many more. While each has educational value, attempting to learn all of them simultaneously often produces shallow understanding rather than practical competence.
Breadth rarely compensates for depth.
A trader who understands three core market structures exceptionally well is usually better positioned than one who recognises thirty patterns superficially.
The objective is not to know every possible formation.
It is to recognise a small number of high-quality structures consistently.
Mastery comes through repetition.
Confidence develops through familiarity.
The following three structural concepts provide an excellent foundation for most developing traders.
Support and Resistance
Support and resistance are among the oldest and most reliable concepts in technical analysis.
They are not magical lines drawn on a chart.
They represent areas where collective market memory exists.
A level where price previously reversed often attracts attention when revisited. Traders who bought there remember opportunity. Traders who sold there remember regret. Institutions may still have pending orders around those zones. This collective memory frequently influences future behaviour.
Support develops where buying pressure has previously overcome selling pressure.
Resistance develops where selling pressure has previously exceeded buying pressure.
These levels should be viewed as zones rather than precise prices.
Markets rarely reverse at an exact number.
Instead, they often react within an area where supply and demand begin to rebalance.
Identifying these zones is straightforward.
Observe previous swing highs and swing lows.
Look for areas where price changed direction decisively or consolidated before making a meaningful move.
These historical reactions frequently become reference points for future decisions.
However, support is not permanent.
Resistance is not absolute.
Strong buying can overcome resistance.
Strong selling can break support.
Their value lies in probability—not certainty.
Support and resistance answer an important question:
Where has the market previously demonstrated conviction?
Trendlines
If support and resistance identify horizontal structure, trendlines reveal directional structure.
An uptrend naturally produces higher lows.
Connecting those higher lows often reveals a rising trendline that visually reinforces the underlying trend.
Similarly, connecting lower highs during a downtrend highlights persistent selling pressure.
Trendlines are valuable because they simplify market structure.
Rather than focusing on every individual candle, they encourage observation of the broader directional rhythm.
When price respects a trendline repeatedly, confidence in that structure gradually increases.
When price breaks a well-established trendline, it often signals one of two possibilities:
- a temporary acceleration in volatility, or
- a meaningful shift in market behaviour.
The distinction becomes clearer when trendlines are evaluated alongside price structure, volume, and broader market context.
Trendlines are not mechanical trading signals.
They are visual frameworks that help organise observation.
Because trendlines involve human judgement, two experienced traders may draw them slightly differently.
That subjectivity is normal.
Consistency improves with practice.
The purpose of a trendline is not precision.
Its purpose is perspective.
Essential Candlestick Patterns
Individual candles tell small stories.
Patterns emerge when those stories are viewed within their surrounding context.
Certain candlestick formations deserve attention because they often reflect meaningful shifts in behaviour rather than random fluctuations.
A hammer—or pin bar—forming near support suggests rejection of lower prices.
Sellers briefly controlled the session.
Buyers responded aggressively enough to reclaim much of that decline before the close.
An engulfing pattern often reflects changing momentum.
A bullish engulfing candle appearing after a decline may indicate renewed buying interest.
A bearish engulfing pattern developing near resistance may suggest increasing selling pressure.
A doji represents uncertainty.
Neither buyers nor sellers establish clear dominance before the session concludes.
When a doji appears after an extended directional move, it may indicate temporary exhaustion or increasing indecision.
None of these patterns guarantees reversal.
They simply reveal changing behaviour between buyers and sellers.
Context always determines significance.
A hammer appearing randomly inside a sideways market carries less meaning than a hammer forming at major weekly support within a broader uptrend.
“Patterns reveal probability. They never promise certainty.”
Mastery comes not from memorising names, but from repeatedly observing how these formations behave under different market conditions.
Depth always outweighs quantity.
Three Indicators That Add Value
Price remains primary.
Price is evidence.
Everything else is interpretation.
Every technical indicator—whether trend-following, momentum-based, or volatility-driven—is ultimately derived from historical price data.
Indicators possess no independent intelligence.
They reorganise information that already exists within price.
Recognising this hierarchy changes how they should be used.
A disciplined trader does not ask:
“Which indicator should tell me what to do?”
Instead, the better question becomes:
“Which indicator can help me understand what price is already suggesting?”
This subtle distinction separates confirmation from dependence.
Indicators are most valuable when each serves one clearly defined analytical purpose.
For example:
- A trend indicator helps determine directional bias.
- A momentum indicator measures the strength behind that movement.
- A volatility indicator provides context regarding market expansion or contraction.
Each answers a different question.
Together, they complement observation rather than compete with it.
Problems arise when indicators become substitutes for thinking.
Traders begin waiting for crossovers, divergences, coloured arrows, or automated alerts without first examining whether the broader market structure justifies action.
Decision-making gradually shifts from analytical reasoning to mechanical reaction.
That is precisely where inconsistency begins.
“Indicators clarify behaviour. They do not create opportunity.”
The objective is not to eliminate technical indicators.
Nor is it to accumulate as many as possible.
The objective is selective precision.
A small number of complementary tools, understood deeply and applied consistently, almost always provides greater clarity than a crowded chart filled with overlapping signals.
The following three indicators remain among the most practical because each contributes a distinct perspective without overwhelming the decision-making process.
Moving Averages
Moving averages remain among the most widely used tools in technical analysis because they simplify one of the market’s most important questions:
What is the prevailing direction?
Instead of reacting to every individual price fluctuation, moving averages smooth historical price data to reveal the broader trend.
Two primary variations are commonly used.
The Simple Moving Average (SMA) assigns equal weight to every observation within the selected period.
The Exponential Moving Average (EMA) gives greater emphasis to more recent price data, allowing it to respond more quickly to changing market conditions.
Common periods include 20, 50, 100 and 200.
Each reflects a different level of market participation.
Shorter averages respond rapidly to changing momentum.
Longer averages react more slowly but often provide greater structural stability.
A rising moving average generally reflects improving trend health.
A declining moving average often indicates persistent weakness.
During established trends, moving averages frequently act as dynamic areas of support or resistance. Price may retrace towards a rising average before continuing higher, or rally towards a declining average before resuming its downward movement.
However, moving averages perform best in trending environments.
During sideways or range-bound markets, repeated crossovers often generate conflicting signals and increase the likelihood of false entries.
Understanding their limitations is just as important as understanding their strengths.
Moving averages identify direction.
They rarely identify precise turning points.
Their greatest value lies in helping traders remain aligned with the dominant market structure rather than reacting to every short-term fluctuation.
RSI (Relative Strength Index)
The Relative Strength Index (RSI) attempts to answer a different question.
Not where price is moving—
but how strongly it is moving.
RSI measures momentum on a scale between 0 and 100.
Traditionally:
- Readings above 70 are considered overbought.
- Readings below 30 are considered oversold.
These thresholds provide useful reference points, but they should never be interpreted mechanically.
Strong trends frequently remain overbought or oversold far longer than most beginners expect.
A rising market can remain above 70 while continuing to advance for weeks.
Similarly, prolonged downtrends may remain below 30 while price continues declining.
Treating these levels as automatic reversal signals often results in premature exits and unnecessary losses.
Context changes everything.
One particularly valuable application of RSI involves divergence.
For example, if price records a new high while RSI fails to reach a corresponding high, momentum may be weakening even though price continues rising.
Likewise, price making lower lows while RSI forms higher lows may suggest that selling pressure is beginning to diminish.
Divergence does not predict reversal.
It simply highlights a change in momentum that deserves closer observation.
Like every technical indicator, RSI becomes significantly more valuable when interpreted alongside market structure rather than in isolation.
Momentum should confirm price.
It should not replace it.
Bollinger Bands
While moving averages focus on trend and RSI focuses on momentum, Bollinger Bands primarily measure volatility.
They attempt to answer another essential market question:
How much is price expanding—or contracting—relative to its recent behaviour?
Bollinger Bands consist of three components:
- A central moving average.
- An upper band positioned above it.
- A lower band positioned below it.
The outer bands typically represent two standard deviations from the moving average, creating a dynamic framework that adjusts automatically as volatility changes.
When the bands expand, market volatility is increasing.
When they contract, volatility is compressing.
Periods of unusually narrow bands frequently precede larger directional movements as markets transition from contraction to expansion.
This characteristic makes Bollinger Bands especially valuable for recognising changing market conditions.
One common misconception deserves clarification.
Price touching the upper band does not automatically imply that the market is overbought.
Similarly, touching the lower band does not automatically indicate oversold conditions.
In strong trends, price can remain near one band for extended periods.
Markets often “walk the band” while momentum remains intact.
Attempting to fade these moves simply because price touches an outer band can become expensive.
Instead, Bollinger Bands should be interpreted within broader market structure.
In range-bound conditions, repeated movement between the upper and lower bands may reflect mean-reversion behaviour.
In trending conditions, expanding bands often reinforce directional strength rather than signal exhaustion.
Volatility provides context.
Context improves judgement.
“Volatility expansion reflects participation. Volatility contraction stores potential energy.”
When understood alongside trend and momentum, Bollinger Bands complete a balanced analytical framework without unnecessarily complicating the chart.
Indicators are valuable.
But they remain secondary.
Each one begins with the same source.
Price.
Long before algorithms calculated moving averages or oscillators measured momentum, traders observed something far simpler—the movement of price itself.
Understanding that original language changes how every indicator is interpreted.
It shifts attention away from mathematical outputs and back towards the behaviour they attempt to describe.
The next section therefore steps beyond indicators entirely.
It returns to the one element every technical tool ultimately depends upon.
Reading Raw Price Action
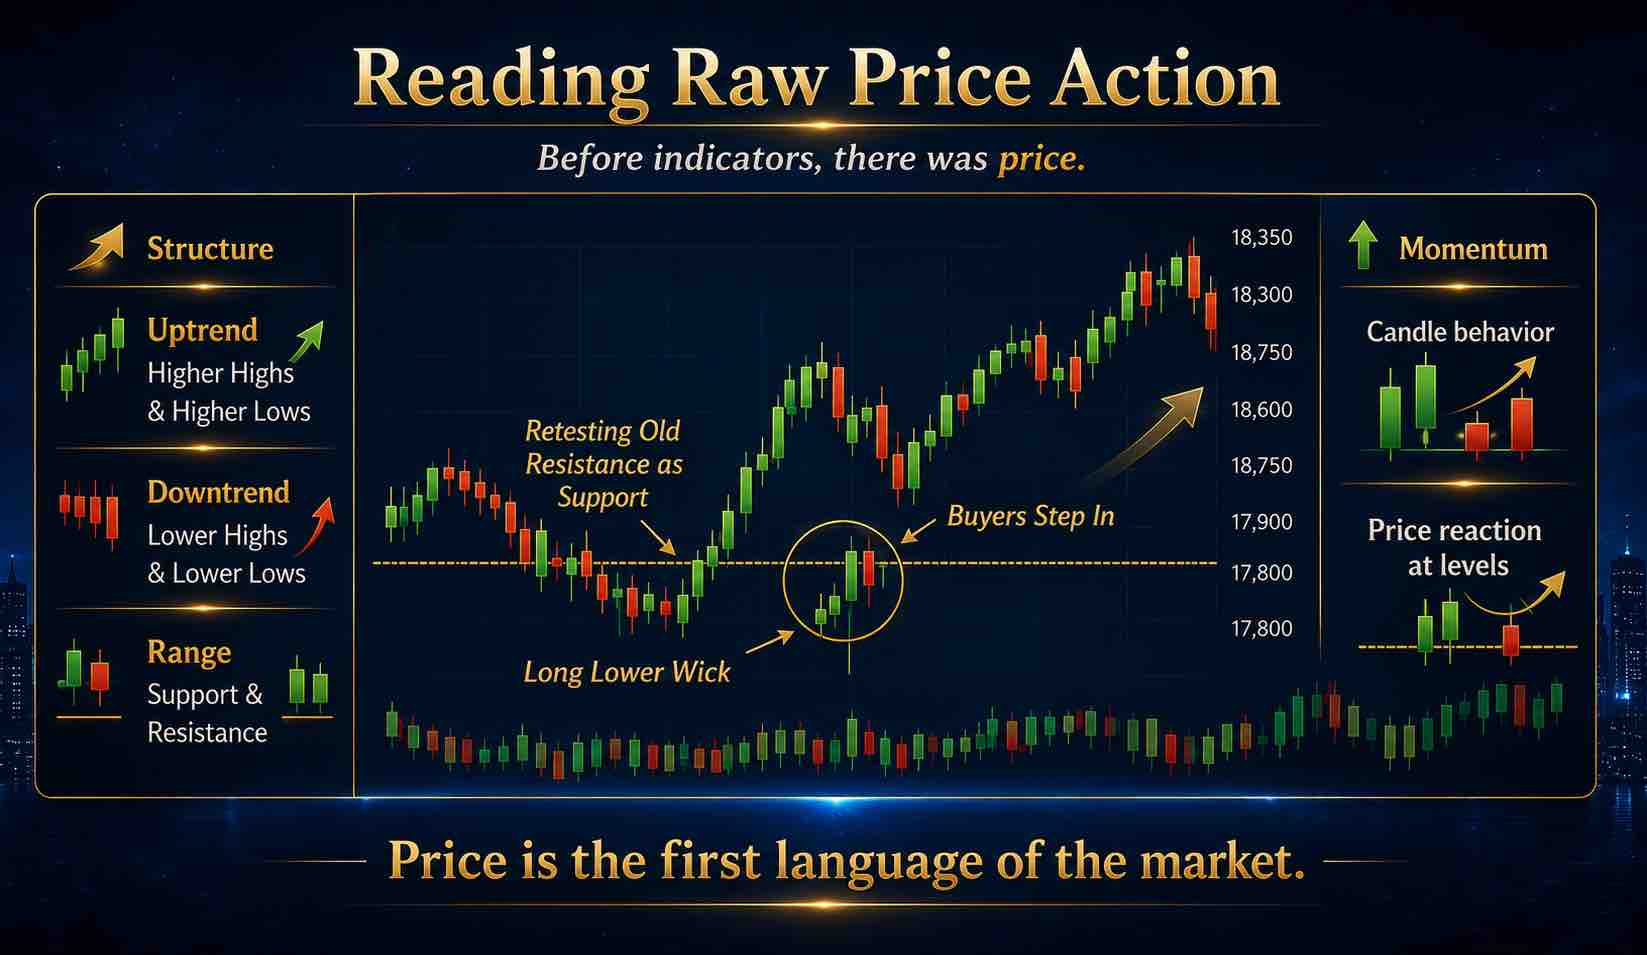
Before indicators, there was price.
Long before charts were layered with moving averages, oscillators, volatility bands, and algorithmic overlays, traders relied on one source of information: the movement of price itself.
There were no digital platforms.
No automated alerts.
No coloured buy or sell signals.
Yet markets functioned.
Traders observed how price advanced, retraced, accelerated, paused, and reversed. Through repeated observation, they learned to interpret behaviour directly from the market rather than through mathematical transformations of it.
Modern indicators did not replace price.
They interpret it.
Moving averages, oscillators, Bollinger Bands, and countless other technical tools are all derived from historical price data. They process price, smooth it, measure it, and reorganise it into forms that are easier to interpret.
Price remains the raw material.
Indicators are the processed output.
Understanding this distinction changes how technical analysis is approached.
A trader who learns to read price directly develops something no indicator can provide independently—a first-hand understanding of market behaviour before it is filtered through mathematical calculations.
Price speaks first.
Indicators respond later.
When charts become less crowded, certain structural characteristics begin to stand out naturally.
The first of these is structure.
Structure is the market’s first language.
Understanding Market Structure
Every market, regardless of instrument or timeframe, generally exists in one of three structural conditions:
- An uptrend
- A downtrend
- A range
Recognising which condition currently exists provides context for every decision that follows.
An uptrend reveals itself through a sequence of higher highs and higher lows.
Each rally exceeds the previous high.
Each pullback remains above the previous low.
This recurring behaviour indicates that buyers continue accepting progressively higher prices while defending increasingly higher support levels.
The structure itself communicates confidence.
Pullbacks are no longer viewed as weakness.
Instead, they frequently represent opportunities for fresh participation within an established trend.
A downtrend tells the opposite story.
Lower highs and lower lows develop sequentially.
Each recovery attempt loses momentum sooner than the previous one.
Selling pressure consistently outweighs buying interest.
Rallies become shorter.
Declines become more convincing.
Rather than chasing temporary recoveries, disciplined traders recognise that the broader structure continues to favour sellers until evidence suggests otherwise.
The third condition is a range.
Here, neither buyers nor sellers establish lasting control.
Price oscillates between relatively well-defined support and resistance zones.
Attempts to break higher repeatedly fail.
Attempts to move lower attract renewed buying.
Markets spend considerable time in these equilibrium phases.
Trend-following strategies often struggle within ranges because sustained directional movement never fully develops.
Instead, attention shifts towards support, resistance, and behavioural reactions near the edges of the range.
Understanding whether the market is trending or ranging answers an essential question:
Who currently controls the market?
Every strategic decision that follows should respect that answer.
Reading Momentum Through Price
Once structure becomes clear, attention naturally shifts towards momentum.
Momentum is not simply movement.
It reflects the urgency behind that movement.
Consider two five-minute candles.
One travels fifty points.
Another covers only ten.
The numerical difference alone tells only part of the story.
The larger candle often reflects aggressive participation.
Buyers or sellers acted decisively, overwhelming opposing orders and moving price rapidly across multiple levels.
The smaller candle communicates something different.
Participation has slowed.
Conviction has weakened.
Liquidity may have thinned.
Opposing orders may be absorbing much of the movement.
The pace of price movement often communicates as much as its direction.
Momentum also becomes visible through the relationship between the opening and closing prices of each candle.
A candle closing near its high suggests that buyers maintained control throughout most of the session.
Even if sellers temporarily pushed price lower, buying pressure ultimately prevailed before the period concluded.
Conversely, a candle closing near its low reflects sustained selling pressure.
Attempts by buyers to recover were unable to alter the outcome before the close.
Every candle therefore becomes more than a coloured bar.
It becomes a concise record of the ongoing negotiation between supply and demand.
When viewed collectively, these individual negotiations begin telling a much larger story.
Price gradually transforms from random movement into observable behaviour.
Seeing Structure in Practice
Consider a simple example involving the Nifty 50 Index.
Assume the market has been advancing steadily for several sessions.
The chart displays a clear sequence of higher highs and higher lows.
Momentum remains healthy.
Buying pressure appears consistent.
Eventually, price begins to retrace.
Rather than interpreting this decline as immediate weakness, the trader first asks a more important question:
Where is price pulling back to?
The decline approaches an earlier resistance level that had previously been broken.
In technical analysis, former resistance frequently attracts attention when revisited because market participants often reassess whether that previous barrier may now function as support.
As price approaches this zone, selling pressure begins losing momentum.
A candle develops with a relatively small real body and a long lower shadow.
During the session, sellers briefly forced price beneath support.
Buyers responded.
By the close, most of that decline had been recovered.
Without consulting a single indicator, several observations become possible.
The broader trend remains upward.
Price has returned to an important structural area.
Buying interest appears to be emerging near that level.
The market itself has communicated this information.
No mathematical transformation was required.
Structure told the story.
This illustrates why experienced traders frequently study price first and indicators second.
Indicators may reinforce what price already suggests.
They should rarely become substitutes for observing price directly.
“The cleaner the chart, the clearer the conversation.”
Simplicity Creates Consistency
As traders become increasingly comfortable reading raw price behaviour, something interesting begins to happen.
Indicators gradually lose their position as primary decision-makers.
They become supporting tools.
Confirmation replaces dependence.
This does not diminish their usefulness.
Moving averages continue helping identify trend.
Momentum indicators continue providing additional perspective.
Volatility tools continue measuring market expansion and contraction.
However, price becomes the starting point for every analysis.
A cleaner chart encourages calmer observation.
Fewer competing signals reduce cognitive overload.
Decision-making becomes less reactive because attention remains focused on what the market is actually doing rather than what multiple indicators appear to be suggesting.
Markets rarely hide their intentions completely.
More often, those intentions become difficult to recognise because excessive information obscures the underlying behaviour.
The quieter the chart becomes, the easier it is to recognise the language of price.
Consistency Over Perfection
In trading, reliability almost always outperforms occasional brilliance.
A strategy producing consistent, repeatable outcomes over many trades generally creates stronger long-term results than one delivering spectacular successes followed by unpredictable failures.
A method that performs reasonably well across different market conditions gradually builds trust.
A method that appears extraordinary before repeatedly collapsing destroys confidence just as quickly.
“Reliability compounds. Spectacular inconsistency destroys.”
Clarity of strategy therefore rests not on complexity, but on repeatability.
Once traders understand how to observe price directly, another misconception naturally emerges.
If price can be read more clearly…
How precise must the entry actually be?
That question leads to one of the most persistent myths in trading.
The Myth of the Perfect Entry
Many traders believe that long-term success depends upon one defining skill:
Finding the perfect entry.
If they can buy at the exact bottom, risk appears to disappear.
If they can enter precisely at the breakout, profits seem almost inevitable.
The perfect entry gradually becomes the holy grail.
This belief is understandable.
It is also misleading.
Entry certainly matters.
It influences position size.
It affects stop-loss placement.
It shapes the initial risk-to-reward relationship.
But entry represents only one variable within a much larger decision-making framework.
A technically excellent entry combined with poor risk management frequently produces disappointing outcomes.
Conversely, a reasonably good entry supported by disciplined position sizing, sound capital management, and consistent execution often survives—and prospers.
Trading success is rarely determined by precision alone.
It is determined by process.
Why Entry Becomes an Obsession
The attraction of perfect entries begins with psychology.
Markets are uncertain by nature.
Human beings prefer certainty.
Finding the “perfect” price appears to offer control over an environment that cannot actually be controlled.
That illusion becomes comforting.
Regret strengthens the obsession.
A trader hesitates.
Price begins moving.
The opportunity appears to disappear.
Immediately the mind starts replaying the moment.
“If only I had entered two minutes earlier…”
“If only I had bought five points lower…”
The actual outcome becomes less important than the imagined alternative.
Social media magnifies this behaviour.
Charts displaying flawless entries and exits circulate constantly.
They show the bottom.
They show the top.
They rarely show:
- the losing trades,
- the abandoned ideas,
- the risk taken,
- or the psychological uncertainty that accompanied the decision.
Perfection becomes the visible benchmark.
Reality becomes invisible.
A Simple Comparison
Consider two traders observing the same stock.
Trader A waits for absolute precision.
Price moves from ₹502 to ₹505.
Then to ₹508.
Then ₹510.
Each time, the trader refuses to participate, convinced that a pullback to ₹500 is inevitable.
The pullback never comes.
Price eventually rallies towards ₹550.
Frustration replaces patience.
The next opportunity is chased emotionally.
Discipline disappears.
Now consider Trader B.
Before the session begins, a written trading plan already exists.
The acceptable buying zone has been defined between ₹500 and ₹510.
The stop-loss has been planned below ₹495.
The trade is entered at ₹508.
Price briefly retraces to ₹503.
Nothing changes.
The broader structure remains intact.
Eventually the stock also advances towards ₹550.
The entry was not perfect.
The execution was.
Markets rarely reward perfection.
They consistently reward preparation.
The Deeper Truth
The search for the perfect entry is rarely about price.
It is usually about certainty.
Unfortunately, certainty does not exist in financial markets.
Markets offer probabilities.
Never guarantees.
Accepting this truth changes behaviour dramatically.
Instead of searching endlessly for the exact turning point, disciplined traders identify areas where probability appears favourable.
Good enough replaces perfect.
Structure replaces prediction.
Risk management replaces hope.
The perfect entry remains imaginary.
A disciplined process remains practical.
A Framework for Evaluating Entry Quality
Rather than asking:
“Did I enter at the perfect price?”
a better question becomes:
“Was my entry supported by quality evidence?”
Three factors consistently improve entry quality.
Confluence
Confluence exists when several independent observations reinforce the same conclusion.
For example:
- Price approaches an established support zone.
- A rising moving average intersects that area.
- A bullish candlestick formation develops.
- Broader market structure remains constructive.
Each observation contributes additional context.
None guarantees success.
Together, they improve probability.
The objective is not to accumulate dozens of confirmations.
It is to identify a small number of meaningful ones.
Confluence improves confidence without encouraging overconfidence.
Volume Confirmation
Price reveals direction.
Volume reveals participation.
A breakout occurring with expanding volume often reflects increasing conviction.
More participants are supporting the move.
Conversely, a breakout occurring on weak volume deserves greater caution.
Participation remains limited.
Similarly, declining selling volume near support may indicate that downward pressure is gradually weakening before buyers begin reappearing.
Volume never replaces price.
It strengthens—or weakens—the story price is already telling.
Conviction becomes easier to recognise.
Noise becomes easier to ignore.
Structural Context
Context remains the foundation of every high-quality entry.
Buying within an established uptrend after a healthy pullback carries very different probabilities from buying after an extended vertical rally.
Likewise, selling into an established downtrend differs fundamentally from attempting to predict the exact market top.
Structure should always answer the first question.
Timing answers the second.
“Timing refines strategy. It never replaces structure.”
When context and timing work together, entries become significantly more consistent.
Good Entries Versus Lucky Entries
Imagine a stock listed on the NSE trading within a healthy long-term uptrend.
Higher highs.
Higher lows.
Consistent buying pressure.
Price gradually retraces towards a well-defined support zone that also aligns with a rising moving average.
A bullish engulfing candle forms.
Volume expands noticeably.
The broader market remains supportive.
The stop-loss naturally fits beneath the recent swing low.
This represents a structured entry.
Every observation supports the same conclusion.
Outcome remains uncertain.
Probability improves.
Now compare that with another trader.
Five consecutive bullish candles attract attention.
Momentum appears exciting.
Without examining structure, volume, or broader market conditions, the trader buys simply because price has been rising.
Fortunately, the rally continues.
Profit follows.
The trader concludes that the decision reflected exceptional skill.
The next identical setup fails dramatically.
The earlier success was never evidence of a superior process.
It reflected favourable conditions.
Luck frequently disguises itself as competence.
Disciplined traders learn the difference.
When Tight Stops Work—and When They Don't
Many traders pursue extremely tight stop-losses because they appear mathematically attractive.
Smaller stops create larger theoretical reward-to-risk ratios.
Unfortunately, markets do not respect mathematical preferences.
They respect structure.
Tight stops function exceptionally well when entries occur close to meaningful structural levels.
Buying near established support naturally allows relatively small risk.
Selling near well-defined resistance offers similar advantages.
Problems arise when traders chase price after extended movement.
Normal market fluctuations now become large enough to trigger even well-intentioned stop-losses.
Repeated small losses accumulate.
Frustration grows.
The stop itself was never the problem.
The entry location was.
Stop distance should always follow structure.
Never ego.
Entry quality determines realistic stop placement.
Stop placement determines appropriate position size.
Together, they determine long-term survival.
Once entry is understood within this broader framework, another practical question naturally follows.
How should successful trades actually be managed once they begin moving in your favour?
That brings us to one of the most overlooked aspects of intraday trading.
Why One Lot Is Rarely Enough in Intraday And How to Chase the Full Rally
One of the questions I hear most frequently from traders learning intraday trading is remarkably consistent.
“I caught the direction correctly, but I exited too early.”
“After I booked my profit, the market continued moving exactly as I had expected.”
“When I tried to enter again, I gave back most of what I had already earned.”
The issue is rarely a lack of market knowledge.
More often, it is a lack of trade management structure.
Many traders spend considerable time learning how to enter a position.
Far fewer invest the same effort learning how to manage one after entry.
Yet management frequently determines whether a good idea becomes a good trade.
The Problem with Single-Lot Intraday Trading
For traders operating with a single lot, every price movement feels significant.
A modest retracement appears threatening.
A few points of unrealised profit seem too valuable to risk.
The internal dialogue becomes familiar.
“Book the profit now.”
“What if the market reverses?”
“At least I’ll walk away with something.”
The position is closed.
Moments later, the trend resumes.
The original analysis proves correct.
Now a different emotion emerges.
Fear of missing out.
The trader re-enters at a less favourable price, often after much of the move has already unfolded.
A routine pullback follows.
The second position exits at a loss.
The earlier profit disappears.
By the end of the session, frustration replaces discipline.
This pattern repeats daily across countless trading accounts.
It is not a failure of intelligence.
It is a consequence of inadequate position management.
Why Trade Management Matters More Than Prediction
Many traders assume that correctly predicting market direction guarantees satisfactory results.
Markets rarely operate so generously.
Even an accurate directional view can produce disappointing outcomes if exits are driven by fear rather than structure.
Professional traders understand an important distinction.
Prediction begins the trade.
Management determines the outcome.
Once a position becomes profitable, an entirely new set of decisions begins.
Should profits be protected?
Should the position be allowed to continue?
Should exposure be reduced gradually?
Without predetermined answers, emotional decision-making quickly replaces structured execution.
The objective is no longer proving that the analysis was correct.
It is allowing disciplined management to maximise the value of being correct.
A Structured Multi-Lot Approach
One practical method used by many experienced traders involves dividing the overall position into multiple lots, each serving a different purpose.
Rather than treating every lot identically, each is managed according to a predefined objective.
For example:
- Lot 1 may be exited at the first planned target to secure an initial profit.
- Lot 2 may remain open until a higher structural objective is achieved.
- Lot 3 may continue with a trailing stop, allowing participation in an extended trend.
- Where capital and experience permit, an additional lot may remain available for unusually strong directional moves.
This approach achieves two objectives simultaneously.
First, it converts part of the unrealised profit into realised capital.
Second, it allows continued participation if the trend develops beyond initial expectations.
Emotion gradually loses influence because the trader no longer faces an all-or-nothing decision.
Part of the position has already accomplished its purpose.
The remainder can now be managed objectively.
“Secure a portion of the outcome. Allow the market to decide the rest.”
A Necessary Word of Caution
This approach should not be mistaken for a recommendation to immediately increase position size.
Multiple-lot management requires experience.
It demands planning.
Most importantly, it requires emotional discipline.
For traders still developing consistency, introducing additional lots may simply magnify existing behavioural weaknesses.
Before considering this approach, several foundations should already exist.
Ideally, the trader should have:
- Completed a meaningful period of disciplined observation.
- Demonstrated consistent adherence to predefined trading rules.
- Developed the ability to define entries, exits and stop-losses before execution.
- Shown emotional stability during both profitable and losing trades.
Without these foundations, increasing position complexity often increases risk rather than improving performance.
Learning always precedes scaling.
How This Improves Intraday Decision-Making
Intraday markets move quickly.
A significant directional move in the Nifty or Bank Nifty can unfold within a relatively short period.
Capturing the entire movement with a single position while remaining emotionally detached is challenging.
Partial exits reduce that challenge.
As each predefined objective is achieved, realised profit gradually increases.
Psychological pressure decreases.
The remaining position can now participate without the constant fear of giving everything back.
Rather than attempting to predict the exact end of the move, the trader allows market structure to determine how long participation should continue.
This transforms the role of exits.
They become planned decisions rather than emotional reactions.
What Structured Position Management Requires
Successful multi-lot management depends on preparation rather than improvisation.
Before entering any trade, several questions should already have answers.
Where is the first logical target?
Where does the second objective exist?
At what point should the trailing stop begin?
Under what conditions should the final position be exited?
When these decisions are made before execution, emotional interference reduces dramatically.
The market simply provides feedback.
The trading plan provides direction.
A Principle Worth Remembering
Markets reward preparation far more consistently than reaction.
The objective of trade management is not to capture every available point.
No trader achieves that consistently.
The objective is to participate systematically while protecting both capital and emotional stability.
One carefully managed trade often contributes more to long-term progress than numerous impulsive ones.
“Profit does not come from predicting every movement. It comes from managing each movement with discipline.”
Trade management completes only one part of strategic development.
The next step reaches even deeper.
Most traders never question the tools they inherited.
They simply accept the default settings provided by their charting platform.
That assumption deserves closer examination.
Beyond Default Settings Finding Your Own Edge
Every trader begins somewhere.
For most, that journey starts with the default settings provided by a charting platform.
The standard moving averages.
The standard Fibonacci ratios.
The standard timeframes.
The standard candle colours.
There is nothing inherently wrong with beginning there.
Default settings provide a common language for learning technical analysis.
The mistake occurs when those defaults are never questioned.
Many traders assume that because certain tools appear on every charting platform, they must also represent the most effective way to analyse every market.
Markets are rarely that uniform.
Different instruments possess different characteristics.
Different timeframes produce different behaviour.
Different traders process information differently.
A framework that works exceptionally well for one individual may prove completely unsuitable for another.
The objective is not to reject standard tools.
It is to understand them well enough to decide whether they genuinely suit your own method of observation.
Why Default Settings Can Become Crowded
Financial markets are competitive environments.
Whenever large numbers of participants begin making decisions from identical reference points, those areas naturally attract increased attention.
Popular moving averages.
Common Fibonacci retracement levels.
Widely observed support and resistance zones.
Frequently monitored intraday timeframes.
These areas often become locations where liquidity accumulates.
Institutional participants understand where retail orders frequently gather.
Algorithms recognise recurring behavioural patterns.
None of this implies manipulation.
It reflects the simple reality that crowded behaviour produces predictable order flow.
When everyone watches the same levels, market reactions around those levels naturally become more significant.
Sometimes they hold.
Sometimes they fail dramatically.
Independent thinking therefore becomes increasingly valuable.
Not because default settings are wrong.
But because unquestioned dependence limits observation.
The market rewards original thinking more consistently than copied behaviour.
My Own Journey Towards a Custom Framework
Over many years of observation, journalling, review and refinement, my own analytical framework gradually evolved beyond standard platform defaults.
This did not happen quickly.
Nor did it happen deliberately from the beginning.
It emerged through repeated observation of how different markets behaved under different conditions.
Gradually, I began adapting my tools to match the way I observed price rather than forcing my observation to match the platform’s default settings.
That process eventually led me towards:
- Custom moving average combinations designed around my own market observations.
- Fibonacci ratios refined through extensive journal analysis rather than platform defaults.
- Parallel channel analysis as an important structural framework.
- Price itself as the primary source of information.
These tools work together because they evolved together.
None exists independently of the broader framework.
Just as importantly, I do not suggest that others should copy them.
Your framework should emerge from your own observations.
Not from mine.
“Borrow ideas. Never borrow conviction.”
Why I Removed Candle Colours
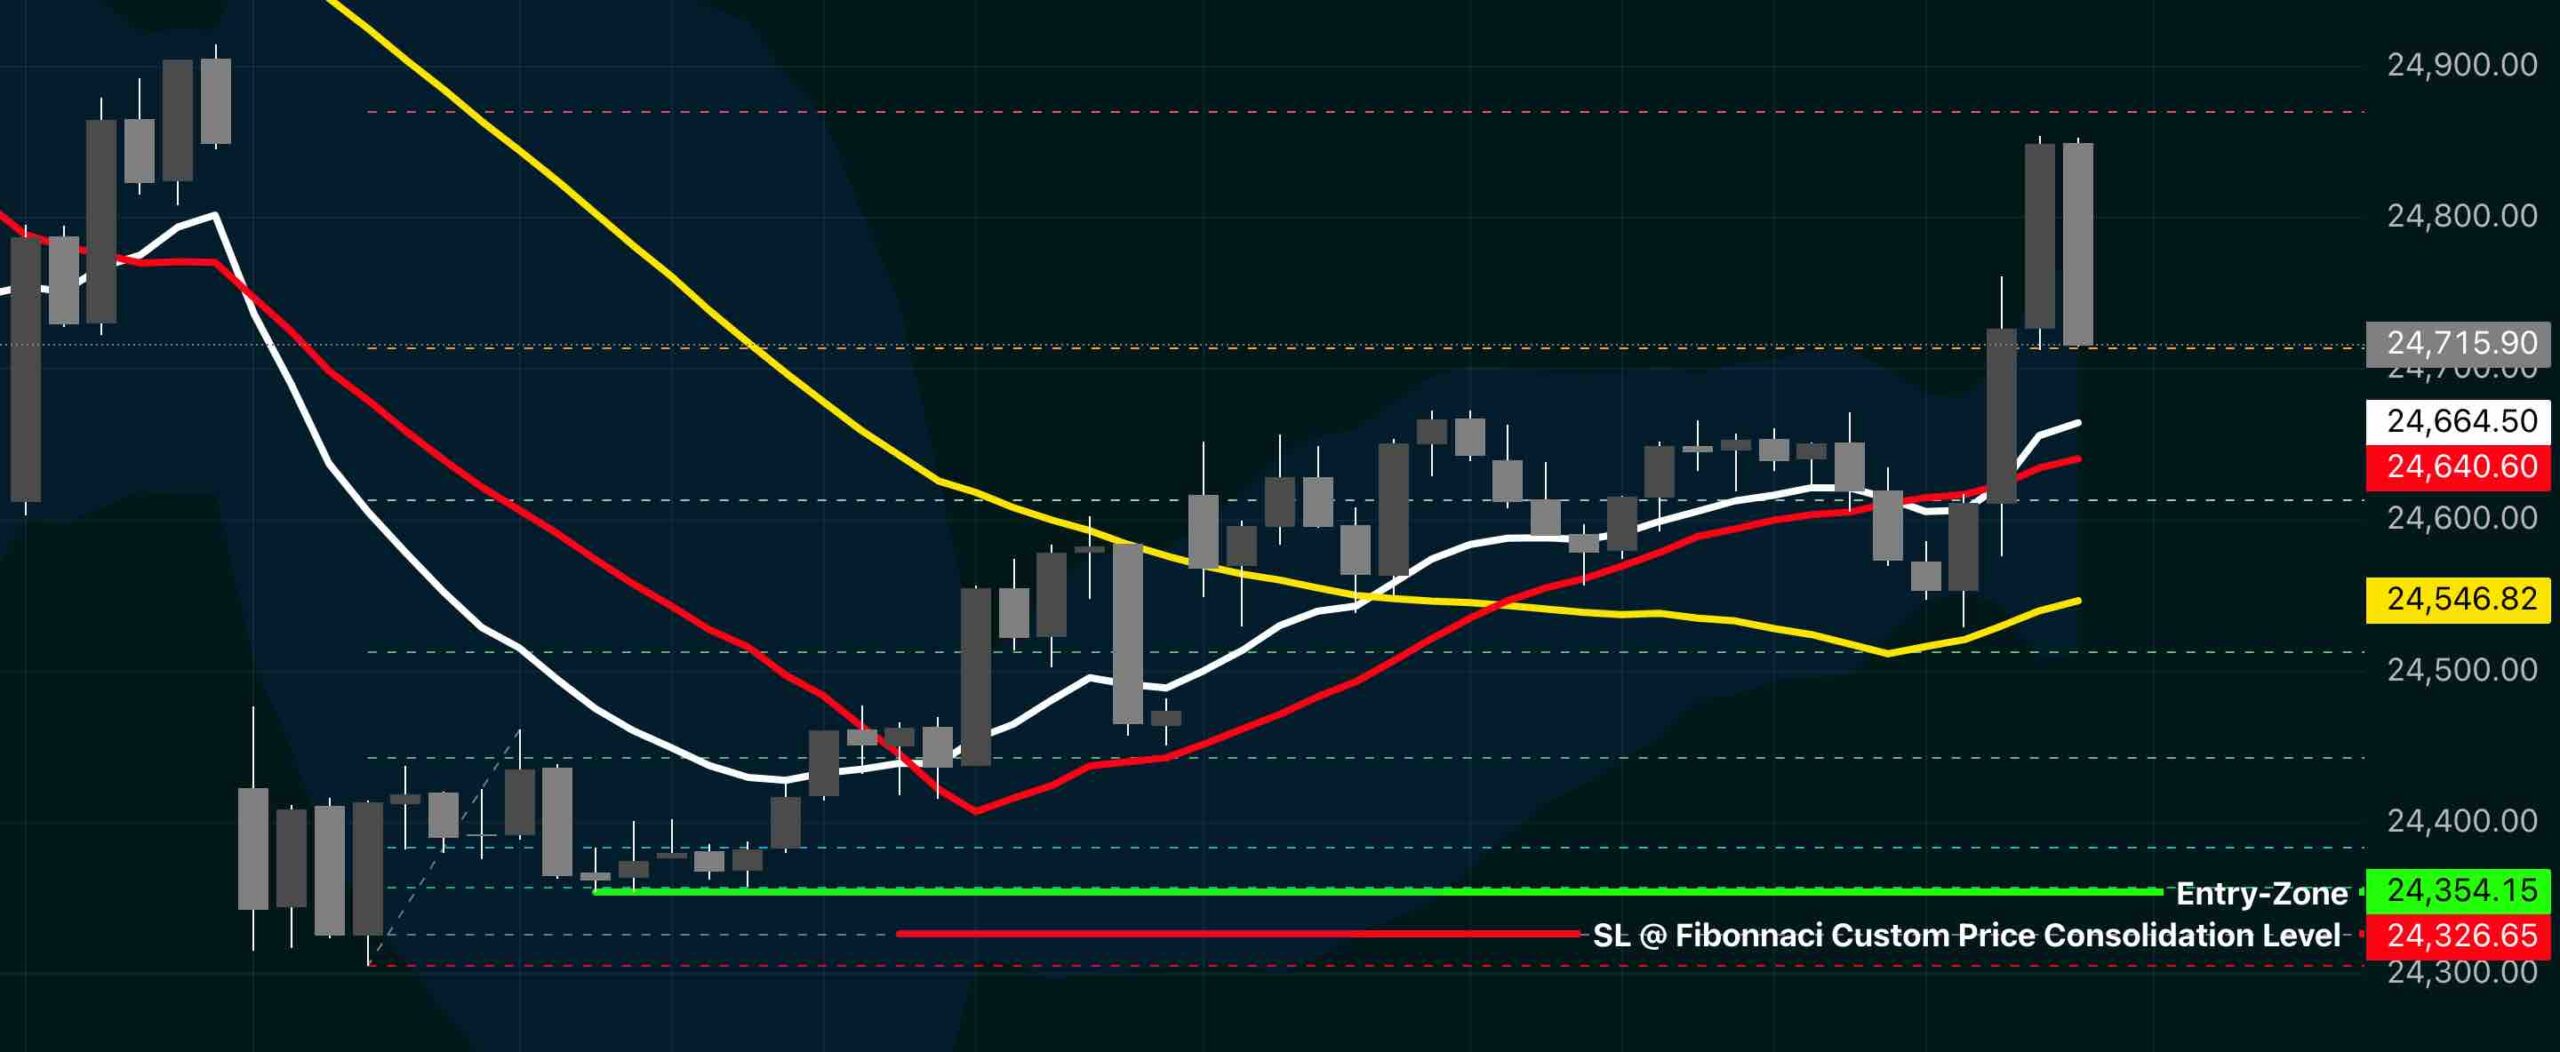
Perhaps the most unusual aspect of my charts surprises people immediately.
Every candle appears in the same colour.
There are no green candles.
There are no red candles.
Only price.
That decision was intentional.
Traditional candle colours carry subtle psychological influence.
Green often creates optimism.
Red frequently creates anxiety.
Although these reactions appear insignificant individually, they accumulate over thousands of observations.
I gradually realised that colour itself was influencing my emotional interpretation of price.
Removing colour removed that distraction.
Instead of reacting emotionally to bullish or bearish candles, attention returned to the only element that truly mattered.
Structure.
Price moving higher remained visible.
Price moving lower remained equally visible.
The emotional association attached to colour gradually disappeared.
This approach will not suit every trader.
It suits mine.
That distinction is important.
The objective is not imitation.
The objective is awareness.
Custom Timeframes — Seeing the Market Differently
The same philosophy eventually extended beyond indicators.
It also influenced timeframe selection.
Most traders naturally monitor standard chart intervals such as one minute, five minutes, fifteen minutes or one hour.
These timeframes remain useful.
They also attract the greatest attention.
My own framework gradually evolved towards custom timeframes selected according to:
- the natural rhythm of the instruments I trade,
- years of behavioural observation,
- historical journal analysis,
- and the pace at which I personally make decisions.
These selections were never arbitrary.
They emerged through experimentation, review and refinement.
Changing the timeframe did not change the market.
It changed my perspective of the market.
That difference proved valuable.
Less noise became visible.
Structure became clearer.
Decision-making became calmer.
The Science Behind Personalisation
Developing a custom framework is not an exercise in creativity.
It is an exercise in evidence.
Every adjustment should emerge from repeated observation rather than personal preference.
Each moving average.
Each timeframe.
Each structural tool.
Each refinement.
Should earn its place through measurable usefulness.
That process requires patience.
It also requires honesty.
Many ideas fail.
Some produce only marginal improvement.
A few demonstrate lasting value.
Those few eventually become part of a personal framework.
This continual refinement represents one of the most important lessons in trading.
Edge rarely arrives through discovery.
It develops through disciplined observation.
“Your framework should evolve because the evidence supports it—not because novelty is attractive.”
What This Means for You
Nothing described here should be interpreted as a recommendation to immediately abandon standard technical tools.
Quite the opposite.
Understand the conventional framework first.
Use it.
Study it.
Observe it.
Only then will you possess enough experience to recognise where thoughtful refinement may become valuable.
A custom framework cannot be downloaded.
It cannot be copied from social media.
It cannot be inherited from another trader.
It must be built.
One observation.
One journal entry.
One refinement at a time.
That is precisely why the objective of structured learning is not to produce identical traders.
It is to help every trader develop independent judgement.
Because ultimately, your greatest edge will never be someone else’s settings.
It will be your own understanding.
Why Averaging Down Is Averaging Up Losses
Few behaviours appear as logical to beginners as averaging down.
If a stock seemed attractive at ₹100, surely it must become even more attractive at ₹80.
Average purchase cost declines.
The position appears cheaper.
Emotionally, the decision often feels reassuring.
Mathematically, however, something very different may be happening.
Risk is increasing.
Exposure is expanding.
The original trading idea is becoming progressively more expensive to defend.
Rather than reducing the problem, averaging frequently magnifies it.
What begins as a manageable loss can quietly develop into significant capital damage.
The real danger lies not in the mathematics.
It lies in the psychology.
Accepting a small loss requires admitting that the original idea was incorrect—or at least premature.
Averaging postpones that admission.
Hope gradually replaces analysis.
Hope feels comfortable.
Markets rarely reward it.
“Adding to a losing position often reflects emotional commitment rather than analytical conviction.”
How Averaging Magnifies Risk
Imagine an options trader purchasing a Nifty call option at a premium of ₹100.
Soon afterwards, the premium falls to ₹70.
Rather than accepting the planned loss, another position is added.
The average purchase price declines.
Confidence temporarily returns.
Price continues falling.
At ₹40, another addition is made.
The market eventually reaches expiry.
The option expires worthless.
What began as a controlled, predefined loss gradually evolved into significantly greater capital erosion—not because the original trade failed, but because discipline failed.
The same behaviour appears in swing trading.
A stock purchased at ₹500 declines towards ₹470.
Instead of respecting the original exit plan, additional shares are purchased.
The average cost falls.
Price declines further.
Another purchase follows.
Eventually the position is closed near ₹400.
The original manageable loss has multiplied into something far more damaging.
Intraday trading produces similar outcomes.
A trader shorts Bank Nifty expecting immediate weakness.
Instead, price continues rising.
Rather than accepting the planned stop-loss, additional short positions are entered at progressively higher prices.
Momentum accelerates.
The final exit occurs at a substantially larger loss than originally intended.
In every example, averaging changed one variable.
Exposure.
The market merely continued doing what it had already been doing.
The Exit-and-Re-enter Alternative
There is another approach.
One that protects both capital and clarity.
When the original market premise is no longer valid, exit.
Accept the information the market has provided.
Step away.
Observe objectively.
If price later rebuilds a high-quality setup, nothing prevents entering again under entirely new conditions.
The previous trade no longer influences the next decision.
Emotion resets.
Analysis becomes cleaner.
Capital remains available.
Exiting is not failure.
It is information.
Re-entering is not inconsistency.
It is adaptability.
“Exit protects capital. Re-entry protects opportunity.”
Admitting Error Is Professional Strength
Markets do not reward stubbornness.
They reward adaptability.
Every experienced trader is wrong.
Frequently.
The difference lies in how quickly those mistakes are recognised and managed.
Small losses acknowledged early become part of the cost of learning.
Large losses defended emotionally become obstacles to future progress.
Protecting capital is never an admission of weakness.
It is an investment in longevity.
Strategy ultimately becomes much simpler than most beginners expect.
Observe clearly.
Enter with structure.
Manage risk consistently.
Exit with discipline.
Review honestly.
Repeat patiently.
Once strategy becomes structured, attention naturally shifts beyond charts themselves.
The next dimension is time.
Not simply chart timeframes.
But the broader rhythm of participation, patience, opportunity cycles and long-term development.
That is where the journey continues.
Key Takeaways — Part III: Clarity About Strategy
- Fewer indicators, understood deeply, beat many indicators applied superficially.
- Price is the primary evidence. Indicators only reorganise what price already shows.
- The perfect entry is a myth — structure and process matter more than precision.
- Averaging down usually magnifies risk rather than reducing it. Exit and re-enter instead.
Part 4 Clarity About Time

Every trader eventually learns that markets move through time.
Fewer realise that traders do as well.
Most discussions about time focus on chart intervals—one-minute candles, hourly charts, daily trends or weekly structures. While those distinctions are important, they represent only one dimension of time.
There is another.
Markets move through cycles.
Strategies evolve through experience.
Confidence develops gradually.
Discipline is built through repetition rather than inspiration.
Time, therefore, is not merely something measured on a chart.
It is one of the most influential variables in every trading journey.
Many costly mistakes are not caused by poor analysis but by poor timing.
Profits are booked too early.
Losses are held too long.
Strategies are abandoned before they have been properly tested.
Expectations mature faster than skill.
The result is often frustration rather than progress.
Understanding time changes that perspective.
It teaches patience without encouraging passivity.
It encourages deliberate action without creating urgency.
It reminds us that every decision exists within a broader process of learning and development.
Just as markets have rhythm, so does the trader.
Learning to recognise both is an essential part of long-term participation.
The chapters that follow explore time from several perspectives.
We begin with chart timeframes and the unique lessons each one teaches.
From there, we examine holding periods, exit timing, market cycles and, ultimately, the discipline required to separate meaningful information from constant distraction.
The objective is not to slow progress.
It is to ensure that progress is built on durable foundations.
Because in trading, timing influences far more than entries and exits.
It shapes judgement itself.
Timeframes as Teachers
Strategy tells you what to look for.
Time tells you when to look.
A trader can master structure, entries and risk management, yet still struggle if the chart itself is examined at the wrong pace for their temperament and objectives.
Every timeframe teaches something different.
Some teach patience.
Some teach speed.
Some simply teach the discomfort of watching too closely.
Recognising which lesson a given timeframe offers is the next step in building genuine clarity.
“The chart does not change. Only your distance from it does.”
A Closer Look at Each Timeframe
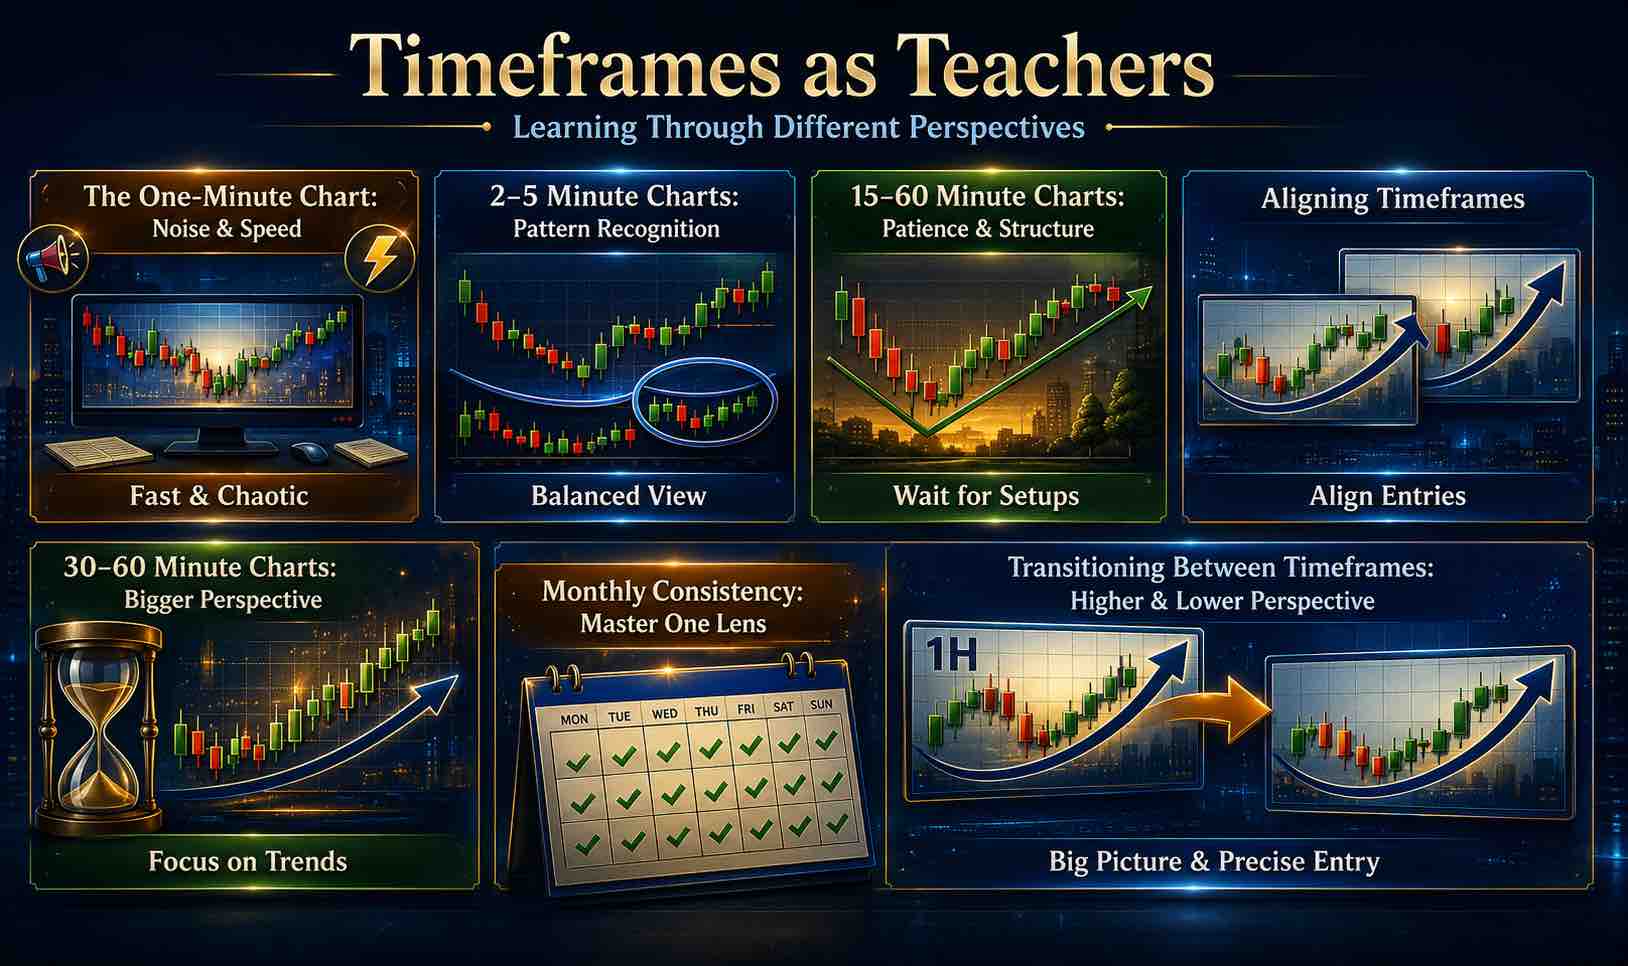
Every timeframe encourages a different way of thinking.
The lower the timeframe, the greater the amount of information presented in a short period. The higher the timeframe, the greater the emphasis on structure rather than immediate fluctuation.
Neither approach is universally better.
The appropriate perspective depends on the question being asked.
A trader searching for broad market direction requires a different lens from one looking for a precise intraday entry.
Learning what each timeframe teaches—and respecting its limitations—reduces confusion and improves decision-making.
The One-Minute Chart — Learning to Recognise Noise
The one-minute chart offers an almost uninterrupted view of market activity.
Every small imbalance between buyers and sellers becomes visible.
Every headline, order flow adjustment and short-term liquidity shift can influence price within seconds.
For experienced traders operating with clearly defined methods, this information may have value.
For beginners, however, it often creates more distraction than clarity.
Every candle appears important.
Every pullback feels significant.
Every breakout seems urgent.
The result is frequently overtrading rather than improved analysis.
The greatest lesson of the one-minute chart is not speed.
It is recognising how much market movement is simply noise.
Learning to ignore unnecessary fluctuations is a valuable trading skill.
Sometimes, the most disciplined decision is not reacting at all.
Two- to Three-Minute Charts — Structure Begins to Emerge
Moving slightly higher in timeframe changes the character of the chart.
Much of the smallest market noise begins to fade.
Short-term support and resistance become easier to identify.
Price swings develop with greater definition.
For traders exploring intraday markets, these timeframes often provide a useful balance between responsiveness and readability.
Patterns become more apparent without demanding constant reaction.
The educational value lies in learning how structure gradually emerges once unnecessary noise is reduced.
Observation becomes easier.
Decision-making becomes calmer.
Five- to Fifteen-Minute Charts — Learning Patience
As timeframes continue to expand, another lesson appears.
Patience.
Candles require more time to develop.
Breakouts require greater confirmation.
Pullbacks unfold more gradually.
The trader is encouraged to wait rather than react.
Minor fluctuations that seemed important on lower timeframes become almost invisible.
This naturally reduces emotional intensity.
Instead of responding to every movement, attention shifts towards broader structure.
Many traders discover that their decision quality improves simply because they are making fewer decisions.
Patience is no longer an abstract virtue.
It becomes a practical advantage.
Thirty- to Sixty-Minute Charts — Developing Perspective
Higher intraday timeframes reveal something many beginners initially overlook.
Proportion.
Small intraday swings become less significant when viewed within the context of a larger trend.
Support and resistance levels gain greater meaning.
Trend development becomes easier to recognise.
Position sizing decisions also become more informed because broader volatility is visible.
Rather than reacting to isolated candles, the trader begins evaluating complete market structure.
Perspective replaces urgency.
This is often where confidence begins shifting away from prediction and towards observation.
The Monthly Consistency Principle
One of the most overlooked habits among developing traders is constantly changing chart timeframes.
Monday is spent analysing five-minute charts.
Tuesday shifts to fifteen minutes.
Wednesday moves to hourly charts.
By Friday, nothing feels familiar.
Every timeframe possesses its own rhythm.
Its own pace.
Its own behavioural characteristics.
Constantly changing perspective prevents genuine familiarity from developing.
A more productive approach is to commit to one primary decision-making timeframe for an extended period.
Observe it consistently.
Study how it responds to news.
Notice how trends develop.
Watch how pullbacks behave.
Over time, repeated exposure creates familiarity.
Patterns become easier to recognise.
Confidence grows naturally because understanding deepens through repetition rather than constant comparison.
“Master one perspective before searching for another.”
Aligning Multiple Timeframes
Although consistency is important, markets rarely need to be viewed through a single lens.
Multiple timeframes become most valuable when each serves a specific purpose.
A higher timeframe may establish overall market direction.
An intermediate timeframe may identify important structural levels.
A lower timeframe may refine the actual execution.
Each perspective answers a different question.
Together, they provide context rather than contradiction.
Confusion usually arises when traders expect every timeframe to tell the same story.
Markets do not work that way.
A short-term pullback can exist within a healthy long-term uptrend.
A lower timeframe reversal may simply represent a pause inside a larger trend.
Understanding hierarchy prevents unnecessary conflict between observations.
The objective is not agreement across every chart.
It is understanding the role each timeframe plays within the decision-making process.
Custom-Built Indicators — Different Timeframes, Different Behaviour
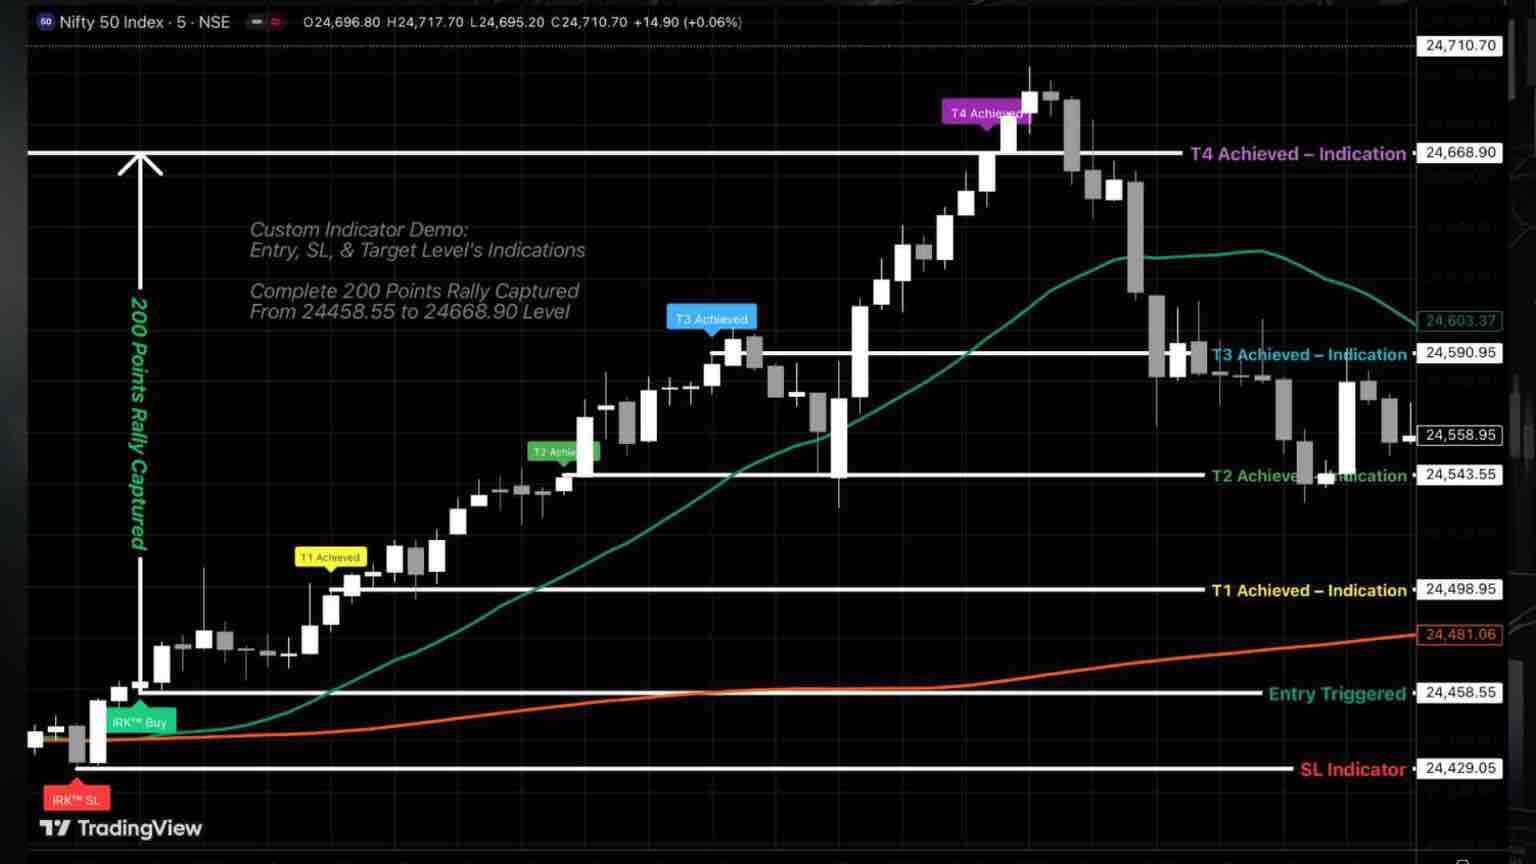
Understanding that every market has its own rhythm eventually led me to another important realization.
Just as every timeframe behaves differently, every timeframe also demands a different analytical framework.
A five-minute chart does not behave like a sixty-minute chart.
An intraday trend does not unfold in the same way as a swing trade.
A positional trend follows an entirely different rhythm.
Expecting one universal indicator setting to perform equally well across all of them is like expecting one map to describe every city accurately.
Over the years, I gradually moved away from standard, one-size-fits-all technical settings and began developing custom-built indicators designed specifically for the markets and timeframes I trade.
The objective was never to make analysis more complicated.
It was to make it more aligned with market behaviour.
The chart below illustrates one such example from the Nifty 50 Index.
Although the trade shown is an intraday example, the underlying principle remains exactly the same across swing trading and positional trading.
The tools change.
The philosophy does not.
Reading the Example
The chart demonstrates a complete trading sequence generated using my custom analytical framework.
Notice several important elements.
- Entry Trigger: 24,458.55, generated by my custom entry conditions for that specific timeframe.
- Stop Loss: 24,429.05, positioned according to market structure rather than an arbitrary percentage.
- Progressive Targets (T1–T4): Each objective is calculated using my custom Fibonacci framework together with structural channel analysis, adjusted for the volatility characteristics of that timeframe.
- Result: The trade successfully captured approximately 200 points, from the initial entry through the final target (T4), while providing predefined decision points throughout the move.
The objective was never to predict every candle.
The objective was to participate in the larger move through a structured process.
What You Will Not Find on My Charts
The chart also reveals something by what it does not contain.
You will not find the conventional tools that appear on most default trading platforms.
For example:
- Standard moving averages such as 20, 50, and 200 are absent because they are not part of my framework.
- Default Fibonacci retracement ratios such as 0.382 and 0.618 have been replaced with ratios developed through years of observation and refinement.
- Traditional green and red candlesticks are intentionally removed. Every candle appears in the same neutral colour so that my attention remains on price behaviour rather than emotional colour associations.
None of these decisions were made to be different.
Each emerged from years of observation, journalling, testing, and continuous refinement.
Why Timeframe-Specific Customisation Matters
One of the most common misconceptions among developing traders is believing that a successful setup can simply be copied from one timeframe to another.
Markets rarely behave that way.
As the timeframe changes, market behaviour changes with it.
Volatility expands.
Noise contracts.
Trends mature differently.
Support and resistance evolve.
Even the rhythm of price movement changes.
Because of this, the tools I use for intraday trading are intentionally different from those I use for swing or positional trading.
The moving averages change.
The Fibonacci relationships change.
The structural expectations change.
Not because complexity is desirable—
but because alignment matters.
Every tool should serve the behaviour of the timeframe it is analysing.
Not the other way around.
Building a Framework Instead of Copying One
This chart should not be viewed as a secret formula.
Nor should it be interpreted as a template to copy.
It is simply a demonstration of what becomes possible when analytical tools evolve through disciplined observation rather than default settings.
The framework shown here was not built in a weekend.
It emerged gradually through years of market observation, detailed journalling, repeated testing, and continuous refinement across changing market conditions.
That same process forms an important part of the 90-Day Market Survival Framework.
The objective is not to teach students to use my indicators.
The objective is to help them develop their own.
Because lasting confidence never comes from borrowing another trader’s chart.
It comes from understanding why your own framework works.
A Principle to Carry Forward
Every trader eventually reaches a choice.
Continue relying on tools that thousands of others use without question.
Or begin the slower—but far more rewarding—process of building a framework aligned with your own observations, your own temperament, and your own understanding of the market.
“The quality of your decisions often depends less on the chart you choose and more on the perspective you bring to it.”
Your charts may never look like mine.
They should not.
But the process of building them should follow the same discipline.
Observe.
Journal.
Test.
Refine.
Repeat.
Because in the end, your greatest edge will never be a particular indicator.
It will be the clarity with which you understand the market
Holding Periods When to Stay, When to Leave
Every trade begins with an entry.
Every trade eventually requires an exit.
Between those two decisions lies one of the least discussed yet most influential variables in trading—time.
Most traders devote considerable attention to identifying entry points. Far fewer devote the same level of thought to managing the period that follows.
Yet holding time influences almost every aspect of a trade.
It shapes profit potential.
It affects risk.
It tests emotional discipline.
It determines whether a well-planned trade becomes a successful execution or an unnecessary source of frustration.
Price tells you where the market is.
Time often determines what you should do next.
Understanding both transforms trading from a collection of isolated decisions into a structured process.
Every Position Exists in Two Dimensions
Every trade has two characteristics.
Price.
And duration.
Price receives almost all the attention.
Duration is often ignored.
A position that reaches its objective within a few hours requires different management from one that moves sideways for several weeks.
A trade that accelerates rapidly demands different decisions from one that progresses slowly through a series of measured advances.
As time passes, market conditions evolve.
Volatility changes.
Momentum strengthens or weakens.
New information emerges.
The quality of a trading decision should therefore be reviewed not only by price movement, but also by how the trade develops over time.
Time changes probability.
Time changes psychology.
Time changes risk.
Recognising this allows traders to manage positions more objectively rather than treating every trade as though time has no influence.
The Myth of "Holding Forever"
One of the most persistent beliefs among new market participants is that holding an investment indefinitely is always the safest approach.
Long-term investing certainly has its place.
But long-term does not mean unquestioned.
Every successful long-term investor reviews positions continuously.
Businesses evolve.
Industries change.
Competitive advantages weaken.
Economic conditions rotate.
Markets reward thoughtful patience.
They rarely reward neglect.
Within Indian markets, leadership has shifted repeatedly between sectors such as banking, information technology, infrastructure, pharmaceuticals, energy and commodities.
A company that leads one economic cycle may struggle during the next.
Holding without periodic review gradually transforms conviction into complacency.
True patience includes observation.
It does not exclude it.
“Time rewards disciplined review, not passive hope.”
Building Structure Around Exits
Random exits produce inconsistent outcomes.
Structured exits improve consistency because they are planned before emotions begin influencing decisions.
There is no universally correct method.
Different trading styles require different approaches.
The important principle is that every exit should have a reason.
Not simply a feeling.
Several frameworks can help create that structure.
Structural Targets
One of the most practical methods is allowing market structure to define potential objectives.
If a position is entered after a pullback within an established uptrend, previous swing highs or significant resistance zones often provide logical reference points.
These areas represent locations where market participants have historically become more active.
For example, a stock purchased near ₹500 after a constructive pullback may encounter meaningful resistance around ₹600 if that area previously attracted selling pressure.
The target emerges from market behaviour rather than personal preference.
Structure provides context.
The trader simply responds to it.
Risk–Reward Targets
Another widely used approach evaluates profit objectives relative to predefined risk.
Suppose a trade risks 5% below the entry price.
A target offering 10% or 15% potential upside creates a favourable reward-to-risk relationship.
This framework helps maintain positive expectancy over a series of trades rather than focusing excessively on individual outcomes.
However, risk–reward ratios should always remain flexible.
Markets do not move according to fixed mathematical formulas.
During low-volatility environments, ambitious targets may never be reached.
During strong trends, conservative targets may unnecessarily limit participation.
The ratio provides discipline.
Market behaviour provides context.
Time-Based Exits
Sometimes, the passage of time itself becomes meaningful.
In options trading, expiry introduces an unavoidable deadline.
Time decay accelerates as contracts approach expiration.
Holding purely because a position remains open can gradually reduce probability even if price has not moved significantly.
The same principle applies to swing trading.
If a position remains inactive for several weeks despite favourable conditions, it may be appropriate to reassess.
Capital committed to stagnant positions carries an opportunity cost.
Time is also a resource.
Using it efficiently matters.
Trailing the Trend
Markets occasionally move much further than expected.
A fixed profit target may secure gains.
It may also end participation prematurely.
Trailing exits attempt to balance both objectives.
As price advances, the protective stop gradually follows.
The exact method varies.
Some traders trail beneath successive swing lows.
Others use moving averages.
Some employ volatility-based methods.
The specific technique is less important than the principle.
Allow successful trades room to continue while progressively protecting realised gains.
A trailing exit does not attempt to predict the end of a trend.
It simply responds as the trend develops.
The 80/20 Principle
One practical framework that combines discipline with flexibility is partial profit-taking.
Instead of closing an entire position at the first objective, consider dividing the decision.
When a predefined target is reached, approximately 70–80% of the position may be exited.
The remaining 20–30% can continue with a structured trailing stop.
This approach offers several advantages.
Most profits are secured.
Emotional pressure declines.
The remaining position retains exposure should the trend continue beyond expectations.
For example, a stock purchased near ₹500 may reach its planned objective at ₹600.
Most of the position is exited.
The remainder continues under a trailing stop.
If the trend extends towards ₹650, additional participation becomes possible without placing previously secured gains at unnecessary risk.
This framework accepts an important reality.
No trader consistently captures every point of every move.
Nor is that necessary.
“Secure what the market has already offered while remaining open to what it may still provide.”
A Lesson from Silver
Several years ago, I participated in a silver futures trade on the Multi Commodity Exchange.
The position was established during a period when broader macroeconomic conditions were supporting precious metals.
Inflation concerns were increasing.
Global uncertainty remained elevated.
The technical structure reflected accumulation rather than exhaustion.
As the trend developed, a predefined target zone was reached.
A substantial portion of the position was exited according to plan.
Some questioned the decision.
Momentum remained strong.
Market optimism continued to grow.
In the months that followed, silver advanced considerably further.
Viewed in isolation, the earlier profit-taking appeared premature.
Eventually, however, the market corrected sharply.
Much of the previous advance was retraced.
The experience reinforced several enduring lessons.
Markets can move much further than expected.
Booking profits is not abandoning opportunity.
Re-entry opportunities frequently appear after meaningful corrections.
Most importantly, disciplined exits protect both capital and emotional stability.
Profit secured is never wasted.
Re-entering with Fresh Perspective
Many traders believe exiting a position ends the opportunity.
Markets rarely operate that way.
A completed trade simply concludes one decision.
It does not prevent another.
After an exit, observe how price behaves.
Does previous resistance become support?
Does volume strengthen again?
Does market structure begin rebuilding?
If favourable conditions return, a completely new opportunity may emerge.
There is no obligation to chase the original move.
Fresh analysis creates fresh decisions.
Re-entry based upon renewed evidence is fundamentally different from chasing a market simply because it continued without you.
Managing Regret
Every trader experiences regret.
A position is exited according to plan.
Price continues higher.
The mind immediately calculates the profit that “could have been”.
This response is natural.
It is also unproductive.
A profitable exit executed according to a written framework remains a successful decision regardless of what the market does afterwards.
No trader consistently exits at the highest price.
No trader consistently buys at the lowest.
Those are expectations created by hindsight rather than reality.
The objective is not perfection.
It is consistency.
Regret becomes harmful only when it encourages impulsive re-entry or abandonment of a disciplined process.
Observation is useful.
Self-criticism rarely is.
“A trade managed with discipline is successful even when the market later travels further.”
The Principle to Carry Forward
Holding periods should never be accidental.
They should reflect both market behaviour and your written framework.
Time influences opportunity.
It also influences judgement.
The longer a trade remains open, the greater the importance of reviewing it objectively rather than emotionally.
Well-managed exits protect more than profits.
They protect confidence.
They preserve capital.
They create the flexibility to participate again when new opportunities emerge.
Ultimately, successful traders do not remain in positions because they hope.
They remain because the evidence continues supporting the decision.
And when the evidence changes, so do they.
The discussion now moves from managing time within a trade to managing information around the trade.
In today’s markets, that distinction has become just as important.
The Noise Problem Information vs Understanding
Never before has the individual trader had access to so much information.
Live market data updates continuously.
Economic calendars publish events months in advance.
Corporate announcements are released instantly.
Financial television channels broadcast throughout the trading day.
Social media platforms circulate opinions within seconds of every market movement.
Trading communities discuss every breakout, every correction and every headline.
Information has become abundant.
Clarity has not.
This distinction sits at the centre of one of the greatest challenges facing modern traders.
Access to information does not automatically create understanding.
In many cases, it creates the opposite.
The more voices we hear, the more difficult it becomes to recognise our own.
Information Is Not the Same as Insight
A common misconception among developing traders is that consuming more information will naturally improve decision-making.
The assumption appears logical.
If one news source is useful, five should be better.
If one analyst offers valuable perspectives, perhaps twenty analysts provide even greater certainty.
Markets rarely work this way.
Information answers questions.
Understanding determines which questions are worth asking.
A trader who reads every headline without a structured framework often becomes overwhelmed rather than informed.
Facts accumulate.
Conviction disappears.
The objective is not to know everything.
It is to know what matters to your own process.
What Trading Noise Really Looks Like
Noise is not necessarily incorrect information.
Much of it is perfectly accurate.
Its problem lies elsewhere.
It lacks relevance.
Noise appears in many forms:
- Opinions presented without context.
- Predictions unsupported by risk management.
- Entry suggestions without defined exit criteria.
- Headlines disconnected from broader market structure.
- Emotional reactions presented as objective analysis.
- Constant commentary that encourages urgency rather than understanding.
Even reliable information becomes noise when it has no connection to your trading framework.
A thoughtful macroeconomic discussion may offer little value to an intraday trader managing five-minute setups.
Likewise, minute-by-minute commentary may distract a long-term investor focused on structural trends.
Information becomes valuable only after it passes through a filter.
Without that filter, everything appears important.
With it, most information quietly fades into the background.
Why Noise Is So Attractive
If excessive information is often unhelpful, why do traders seek it so enthusiastically?
Because uncertainty is uncomfortable.
Markets operate through probabilities.
Human psychology prefers certainty.
When someone confidently announces,
“The market will definitely rise tomorrow,”
the statement offers emotional relief even if it lacks analytical depth.
Confidence is persuasive.
Accuracy is optional.
Noise also creates the comforting feeling of participation.
Watching every chart update.
Reading every opinion.
Listening to every prediction.
These activities feel productive because they create constant engagement.
Yet activity should never be confused with progress.
There is another psychological benefit.
Following someone else’s conviction transfers responsibility.
If the trade succeeds, confidence grows.
If it fails, responsibility feels easier to shift elsewhere.
Developing independent judgement requires accepting full ownership of every decision.
That is considerably more demanding.
It is also considerably more valuable.
The Hidden Cost of Noise
Noise rarely destroys a trading account through one dramatic mistake.
Its effects are usually gradual.
A trader exits a well-planned position because an unexpected opinion appears online.
The market later follows the original analysis.
Confidence weakens.
Another trader abandons an established strategy after reading several conflicting forecasts.
Consistency disappears.
Someone who normally trades index futures becomes distracted by excitement surrounding a speculative stock.
The written trading plan quietly loses authority.
None of these decisions appear catastrophic in isolation.
Together, they steadily erode discipline.
Noise weakens structure.
Structure protects judgement.
Once that relationship is understood, selective attention becomes a competitive advantage.
Building an Information Filter
Eliminating information entirely is neither practical nor desirable.
Markets respond to economic events, policy decisions and corporate developments.
The objective is not isolation.
It is intelligent selection.
A practical filtering process begins with four questions.
1. Define Your Arena
Identify exactly what you trade.
If your primary focus is Nifty futures or Bank Nifty options, there is little benefit in monitoring every rumour surrounding small-cap stocks.
The broader the market becomes, the more important narrowing your attention becomes.
Specialisation reduces distraction.
2. Define Your Sources
Choose a limited number of reliable information sources.
One trusted macroeconomic reference.
One dependable source for market announcements.
One or two educational resources that genuinely support your development.
More information does not necessarily improve judgement.
Higher-quality information usually does.
3. Compare Everything with Your Framework
Before acting on any external opinion, pause.
Ask a simple question.
“Does this align with my written trading framework?”
If the answer is unclear, further patience is often the wiser decision.
Your framework should remain the primary reference.
External commentary should remain secondary.
4. Control When You Consume Information
Many traders leave themselves permanently connected to the market.
Every notification receives immediate attention.
Every headline interrupts concentration.
A more disciplined approach is to establish defined review periods.
Prepare before the market opens.
Review after it closes.
During trading hours, allow your written plan—not constant commentary—to guide decision-making.
Attention is a limited resource.
Protect it carefully.
From External Opinions to Internal Clarity
As unnecessary information decreases, several important changes begin to appear.
Decision-making slows.
Not because confidence has weakened.
Because thoughtfulness has increased.
Emotional reactions become less frequent.
Journalling becomes more meaningful because observations are no longer competing with dozens of external opinions.
Patterns become easier to recognise.
Confidence gradually shifts away from prediction and towards preparation.
The quieter the information environment becomes, the easier it is to hear your own reasoning.
This is not about ignoring the world.
It is about ensuring that the world does not constantly interrupt your process.
Protecting Mental Capital
Financial capital receives considerable attention.
Mental capital deserves equal care.
Every decision requires concentration.
Every market session demands emotional energy.
Constant exposure to conflicting opinions gradually exhausts both.
Decision fatigue develops.
Patience declines.
Impulsive behaviour becomes more likely.
Protecting mental capital therefore becomes part of protecting financial capital.
The two cannot be separated.
A clear mind usually produces clearer decisions.
Selective Attention Is a Professional Skill
Institutional traders operate within defined mandates.
Portfolio managers follow documented investment objectives.
Risk teams establish boundaries.
Professional environments reduce unnecessary decision-making by creating structured processes.
Retail traders often attempt the opposite.
Every opinion is considered.
Every forecast is examined.
Every headline appears important.
Information abundance creates the illusion of preparedness.
In reality, it often creates confusion.
Selective attention is therefore not a limitation.
It is a discipline.
Choosing what to ignore is frequently just as important as choosing what to study.
“The market will never stop producing opinions. Your framework decides which ones deserve your attention.”
The Principle to Carry Forward
Information has never been more accessible.
Understanding has never depended more heavily on discipline.
Successful traders do not attempt to consume everything.
They consume what strengthens their decision-making and quietly ignore what does not.
The objective is not becoming the most informed person in the market.
It is becoming one of the most consistent.
When your written framework becomes stronger than the surrounding noise, your decisions become calmer, your confidence becomes steadier and your trading becomes more intentional.
With external distractions now placed into perspective, one final question remains.
If the market, the capital, the strategy, the timing and the information have all been considered…
What, ultimately, is the purpose of trading?
That question leads us into the final part of this blueprint.
Part V — Clarity About Yourself.
Key Takeaways — Part IV: Clarity About Time
- Every timeframe teaches something different — master one before comparing others.
- Holding periods deserve as much planning as entries. Exits should follow evidence, not emotion.
- Protecting attention from noise is now as important as protecting capital.
Part 5 Clarity About Yourself

Markets can be studied.
Charts can be analysed.
Strategies can be refined.
Capital can be managed.
Yet every decision ultimately passes through one final filter.
The trader.
Throughout this blueprint, we have examined the external dimensions of trading.
We explored how markets function.
We discussed the role of capital.
We developed a structured approach to strategy.
We examined the influence of time and the importance of filtering information.
All of these elements matter.
None of them operate independently.
Every rule, every framework and every trading decision is interpreted through your own judgement, emotions and behaviour.
For that reason, the final stage of trading development is not about discovering another indicator or another strategy.
It is about understanding yourself.
Many traders spend years searching for a better system.
Far fewer spend the same amount of time improving the person using that system.
The distinction is profound.
A disciplined trader can often achieve reasonable results with a simple framework.
An undisciplined trader can struggle with even the most sophisticated methodology.
This is why behavioural development deserves its own place within this blueprint.
Trading is not simply a technical activity.
It is a continuous exercise in self-awareness.
Markets expose habits that everyday life often hides.
They reveal impatience.
They reveal overconfidence.
They reveal fear.
They reveal the tendency to seek certainty where none exists.
More importantly, they provide opportunities to recognise and gradually improve those behaviours.
The final chapters of this guide therefore move beyond charts.
They explore purpose.
Growth.
Discipline.
Responsibility.
And the long-term mindset required for sustainable market participation.
Because while markets constantly change, the greatest advantage any trader can develop is a better understanding of themselves.
The Only Goal That Matters
One of the first questions beginners ask is remarkably simple.
“What should my goal be?”
The answers they expect usually involve numbers.
A monthly return.
A capital target.
A specific income.
Those goals are understandable.
They are also incomplete.
The most valuable trading goals rarely begin with profit.
They begin with development.
As experience grows, the definition of success evolves.
The objectives that matter during the first three months differ significantly from those that matter after several years of disciplined participation.
Understanding that progression prevents unrealistic expectations and encourages long-term thinking.
Trading is not a destination reached through one successful year.
It is a craft developed through continuous refinement.
The goals should reflect that reality.
The Only Goal That Matters – in Detailed
Trading goals should evolve as you evolve.
A beginner attempting to achieve the objectives of an experienced professional often creates unnecessary pressure. Likewise, an experienced trader who continues thinking like a beginner may never realise their full potential.
Meaningful progress comes from pursuing the right goal at the right stage.
The journey generally unfolds through four broad phases.
Each builds naturally upon the one before it.
Goal 1 — Survive the First 90 Days
The first objective in trading is not extraordinary profitability.
It is survival.
The earliest months reveal habits that will shape everything that follows.
Can you follow a written plan without repeatedly changing it?
Can you accept a planned loss without immediately trying to recover it?
Can you remain patient when no suitable opportunity exists?
Can you end the trading day without feeling compelled to participate simply because the market was open?
These questions matter far more than the size of your first profits.
During this phase, capital should remain largely intact.
Curiosity should remain alive.
Confidence should remain grounded rather than inflated.
Profits are welcome.
They are not yet the primary measure of progress.
Survival creates the opportunity to continue learning.
“Longevity is the first achievement. Profitability comes afterwards.”
Goal 2 — Build Consistency Before Chasing Profit
Once survival becomes habitual, attention naturally shifts towards consistency.
Consistency does not mean winning every trade.
It means making decisions in a repeatable manner.
Executing entries according to written criteria.
Managing positions according to plan.
Recording observations honestly.
Reviewing mistakes objectively.
A trader who finishes several months close to break-even while consistently following a disciplined process has often made more meaningful progress than someone who earns exceptional returns through unpredictable decision-making.
Consistency strengthens trust.
Not trust in the market.
Trust in your own process.
That confidence becomes invaluable during inevitable periods of drawdown.
Process should become predictable before profits become ambitious.
Goal 3 — Discover and Refine Your Edge
Many traders speak about “finding an edge” as though it were a hidden indicator waiting to be discovered.
In reality, an edge is usually developed rather than found.
It emerges where several elements begin working together.
Your temperament.
Your available time.
Your preferred markets.
Your ability to manage risk.
Your willingness to review your own decisions honestly.
Some traders perform best using structured swing strategies.
Others thrive in carefully planned intraday environments.
Neither approach is inherently superior.
An edge is simply the point where your method consistently aligns with who you are.
Refinement becomes the ongoing objective.
Weak habits are gradually removed.
Strong habits are reinforced.
Your framework becomes clearer with every review.
“An edge is not a secret. It is a process refined through disciplined repetition.”
Goal 4 — Become Self-Reliant
Ultimately, every trader reaches a point where independence becomes the most valuable achievement.
Markets will continue changing.
Strategies will require adjustment.
Opinions will always compete for your attention.
The question is whether your decisions remain anchored in your own framework.
When a trade succeeds, can you explain why?
When a trade fails, can you identify the weakness without blaming the market?
When conditions change, can you adapt without abandoning your principles?
These abilities define maturity far more than short-term profitability.
Self-reliance does not mean rejecting education or refusing guidance.
It means accepting responsibility for every decision once the education has been received.
The market becomes a place of observation rather than emotional conflict.
You no longer trade because someone else believes.
You trade because your own framework provides sufficient evidence.
That transition marks one of the most significant milestones in a trader’s development.
Goals Change as Experience Deepens
One of the reassuring aspects of trading is that no goal remains permanent.
Early goals emphasise survival.
Later goals emphasise refinement.
Eventually, growth becomes less about increasing returns and more about improving judgement.
This evolution happens naturally.
The trader who continues learning gradually discovers that better decisions often produce better outcomes without chasing them directly.
Patience begins replacing urgency.
Discipline replaces excitement.
Reflection replaces reaction.
The focus shifts from asking,
“How much can I make?”
to asking,
“How well can I execute my process?”
That subtle change often marks the beginning of long-term consistency.
The Principle to Carry Forward
No mentor can permanently define your goals.
Markets will gradually reshape them through experience.
Each review.
Each mistake.
Each well-managed trade.
Each difficult decision accepted with discipline.
Your objectives will become more personal and more meaningful.
Not because someone prescribed them.
Because you earned them.
“The market does not reveal your destination. It reveals the person you are becoming on the journey.”
As personal goals become clearer, another important question naturally follows.
If independent thinking is the objective, what role should a mentor actually play?
That distinction deserves careful consideration before we bring this blueprint to its conclusion.
A Living Example Trading With Clarity in Real Time
Frameworks are easy to admire in theory.
They become meaningful only when they are applied under real market conditions.
Charts can be explained.
Risk management can be discussed.
Trading psychology can be taught.
The real measure of any framework, however, lies in whether it can be followed consistently when uncertainty, volatility and emotion become part of the decision-making process.
For that reason, I chose to create a simple demonstration.
Not to prove that the framework is flawless.
But to demonstrate what disciplined execution looks like in practice.
Why a Live Demonstration Matters
Educational concepts become more valuable when readers can observe how they are applied.
That is the purpose of this initiative.
A fresh demat account has been opened using ₹20,000 of my own capital.
This is not an account built upon years of accumulated gains.
It does not rely on historical performance.
It begins from a clean slate.
Every trade executed within this account follows the same principles discussed throughout this blueprint:
- Clarity about markets.
- Disciplined capital allocation.
- Structured entries.
- Defined exits.
- Position sizing aligned with risk.
- Continuous journalling and review.
The objective is not to demonstrate perfection.
It is to demonstrate consistency.
Process Before Performance
It is natural for readers to focus on returns.
That is not the primary purpose of this account.
There is no target to transform ₹20,000 into an extraordinary sum within a fixed period.
There is no promise of monthly returns.
There is no attempt to create impressive screenshots for social media.
The purpose is far simpler.
To apply the framework honestly.
To document the outcome objectively.
To learn continuously.
Some trades will generate profits.
Others will result in losses.
Both outcomes are expected.
The important question is not:
“Did the trade make money?”
The more meaningful question is:
“Was the framework followed?”
That distinction lies at the heart of disciplined trading.
“A profitable trade executed without discipline teaches the wrong lesson. A disciplined trade that results in a controlled loss still strengthens the process.”
What Readers Can Expect
The account is intended to provide transparency rather than entertainment.
Over time, readers will be able to observe:
- The reasoning behind selected trades.
- Entry and exit discipline.
- Position sizing decisions.
- Risk management during changing market conditions.
- Weekly and monthly reflections drawn from the trading journal.
- Lessons learned from both successful and unsuccessful trades.
The emphasis will remain on behaviour rather than prediction.
Markets change.
Principles should not.
Observe the Process, Not the Position
One of the easiest mistakes a developing trader can make is confusing observation with imitation.
The purpose of sharing trades is educational.
It is not an invitation to replicate them.
Every trader operates under different circumstances.
Capital differs.
Financial responsibilities differ.
Risk tolerance differs.
Time availability differs.
A position that is appropriate for one individual may be entirely unsuitable for another.
For that reason, this account should be viewed as a case study in disciplined execution—not as a source of trading signals.
Observe the reasoning.
Study the process.
Question the decisions.
Then compare those observations with your own framework.
Learning occurs through understanding, not copying.
Transparency Includes Losses
Every trader experiences losing trades.
This account will be no different.
Losses will not be hidden because they are part of the educational journey.
A well-managed loss often teaches more than an effortless profit.
It demonstrates whether:
- Risk limits were respected.
- The original trading premise remained valid.
- Emotional discipline was maintained.
- The review process remained objective.
When viewed through that lens, a controlled loss becomes useful information rather than personal failure.
Transparency without losses is incomplete.
Real trading includes both.
An Educational Initiative
It is important to understand the purpose of this demonstration.
It is not:
- Investment advice.
- Trading advice.
- A recommendation to buy or sell any financial instrument.
- A guarantee of future performance.
- A copy-trading service.
It is an educational exercise designed to show how a structured trading framework may be applied in real market conditions.
Readers remain fully responsible for their own financial decisions.
Nothing within this initiative should replace independent judgement, personal research or, where appropriate, professional financial advice.
Markets involve risk.
No framework eliminates that reality.
A good framework helps manage it responsibly.
From Theory to Practice
Throughout this blueprint, we have explored the principles of trading with clarity.
Market structure.
Capital management.
Strategy.
Time.
Behaviour.
A live trading account provides an opportunity to observe how those ideas interact outside the pages of a book.
Sometimes the outcome will be favourable.
Sometimes it will not.
What should remain consistent is the process.
That consistency—not short-term performance—is the true purpose of the demonstration.
“Discipline deserves to be observed just as much as results.”
With a practical example now accompanying the framework, only one step remains.
It is time to bring every principle together and reflect on what this journey has truly been about.
Not predicting markets.
Not chasing certainty.
But developing the clarity to participate with purpose, patience and responsibility.
Key Takeaways — Part V: Clarity About Yourself
- Trading goals evolve: survive first 90 days, then build consistency, then refine an edge, then become self-reliant.
- An edge is developed, not discovered — it emerges from temperament, review and repetition.
- The live ₹20,000 account demonstrates process, not signals. Observe it, don’t copy it.
Conclusion The Journey Is Yours to Walk

Every trading journey begins with a question.
Sometimes it is practical.
“How much capital do I need?”
Sometimes it is technical.
“Which strategy works best?”
Sometimes it is deeply personal.
“Can I really learn to do this consistently?”
This blueprint was never written to provide one universal answer to those questions.
Markets rarely reward borrowed answers.
They reward thoughtful understanding.
Throughout these pages, we have explored trading from five interconnected perspectives.
Each one contributes to a broader philosophy built around clarity rather than certainty.
Looking Back at the Journey
In Part I — Clarity About Markets, we explored the landscape in which every trading decision takes place.
You learned that markets are not a single destination but a collection of different environments, each with its own behaviour, opportunities and risks.
You discovered that choosing an instrument should be an informed decision rather than an emotional one, and that your own professional background, interests and experience can become valuable sources of insight.
Most importantly, you saw why the first ninety days should be devoted to observation before ambition.
In Part II — Clarity About Capital, we shifted attention from markets to the resources required to participate in them responsibly.
We examined what trading capital truly represents—not simply money available for deployment, but a learning budget, an emotional buffer and a measure of personal risk tolerance.
We challenged unrealistic return expectations, explored the importance of bearable capital and demonstrated why sustainable compounding consistently outweighs the pursuit of spectacular gains.
Finally, we examined how thoughtful position sizing protects longevity far more effectively than aggressive exposure.
In Part III — Clarity About Strategy, the discussion moved from preparation to execution.
We began where every strategy begins—with price itself.
You explored why market structure should always take precedence over indicators, why perfect entries remain an illusion and why genuine confidence develops through repeatable processes rather than flawless timing.
You also discovered the importance of building a framework that reflects your own observation instead of copying someone else’s, managing trades with structure instead of emotion, and recognising why averaging down often magnifies rather than reduces risk.
In Part IV — Clarity About Time, we examined one of the most underestimated dimensions of trading.
Time influences far more than chart intervals.
It shapes patience.
It influences judgement.
It determines how long opportunities deserve attention and when they should be released.
You learned that holding periods require structure, that exits deserve as much planning as entries, and that protecting mental attention has become just as important as protecting financial capital in today’s information-rich markets.
Finally, in Part V — Clarity About Yourself, the focus turned inward.
Because every market decision ultimately passes through one person.
You.
We explored how trading goals naturally evolve from survival to consistency, from consistency to refinement, and ultimately towards self-reliance.
We reinforced the importance of developing independent judgement, documenting experience honestly and measuring success through disciplined execution rather than isolated outcomes.
Together, these five dimensions create something far more valuable than a trading system.
They create a framework for decision-making.
The Real Gift Is Not the Answers
Throughout this blueprint, I have shared ideas, observations and experiences drawn from my own journey, years of studying financial markets, reviewing trading journals, and observing how different traders respond to uncertainty.
None of these ideas should become rigid rules copied without reflection.
That would defeat the very purpose of this book.
The greatest value of this blueprint is not that it provides my answers.
It is that it encourages you to discover your own.
The moving averages I use, the way I interpret market structure, the methods I apply across different conditions, and the routines that guide my decisions were not adopted overnight.
They evolved gradually through observation, experience, journalling, review and refinement.
Your framework should evolve in exactly the same way.
Not through imitation.
Through understanding.
That distinction matters.
Markets reward ownership.
Borrowed conviction rarely survives difficult conditions.
Clarity Is a Practice, Not a Destination
One of the greatest lessons the markets continue to teach is that clarity is never permanent.
Markets evolve.
Economic conditions change.
Volatility expands and contracts.
Technology advances.
Participants adapt.
Most importantly, you evolve.
Every review strengthens judgement.
Every mistake reveals something previously overlooked.
Every well-executed trade reinforces discipline.
Learning therefore never reaches a finish line.
For that reason, this blueprint should not become a book you read once and place on a shelf.
It should become a working companion.
Return to it.
Revisit the sections that become relevant as your experience grows.
Compare today’s observations with conclusions you reached months earlier.
Allow your understanding to mature alongside your market participation.
Because trading rewards those who continue learning long after they believe they already understand.
Begin Small. Build Well.
If you are standing at the beginning of your journey, resist the temptation to measure success by speed.
You do not need a large account.
You do not need extraordinary returns.
You do not need to master every market.
Begin with one instrument.
One written framework.
One journal.
One disciplined process.
Observe carefully.
Review honestly.
Improve gradually.
The habits established during the earliest stages often become the foundation upon which every future result is built.
Patience at the beginning usually saves years of unnecessary frustration later.
From Reading to Doing
Knowledge has value only when it changes behaviour.
Reading about discipline is not the same as practising it.
Understanding risk management is not the same as applying it consistently.
This blueprint provides a framework.
Its true value emerges only when the principles become part of your daily decision-making.
That transformation occurs through repetition.
Observation.
Reflection.
Review.
The market remains one of the most demanding teachers available.
It is also one of the most honest.
It responds not to intentions, but to actions.
If You Want a More Structured Learning Journey
Some readers prefer to build these principles independently.
Others value a more structured learning environment.
For those who wish to continue beyond this blueprint, the 90-Day Market Survival Framework has been designed to extend the ideas introduced throughout these pages.
Its purpose is not to provide shortcuts.
Nor does it promise guaranteed outcomes.
Instead, it offers a structured learning process built around observation, journalling, review, disciplined execution and continuous refinement.
The objective remains identical to the one guiding this blueprint.
To help traders build a framework they can eventually call their own.
Because the highest purpose of education is not dependence.
It is independence.
That philosophy remains central to everything TradKlear seeks to build.
A Final Reflection
Markets will always remain uncertain.
That uncertainty is not a flaw.
It is their nature.
Your responsibility is not to eliminate uncertainty.
It is to respond to uncertainty with greater clarity.
There will be profitable periods.
There will be difficult periods.
Both are temporary.
The habits you build are far more enduring.
Protect your capital.
Protect your attention.
Protect your integrity.
Keep learning.
Keep reviewing.
Keep refining.
Above all, remain curious.
Because the greatest traders are rarely those who believe they have mastered the market.
They are those who never stop learning from it.
“The market will test your knowledge, your patience and your character. The framework you build determines how you respond. The journey, however, will always be yours to walk.”
If this blueprint helps you think more clearly, question more thoughtfully, and approach the markets with greater discipline than when you first opened these pages, then it has fulfilled its purpose.
The markets will continue to evolve.
Your understanding should evolve with them.
Keep learning.
Keep observing.
And above all, never stop building a framework you can truly call your own.
Because in the end, lasting success is rarely built on certainty. It is built on clarity.
Disclaimer
Educational Purpose
This blueprint has been prepared solely for educational and informational purposes.
Its objective is to improve the reader’s understanding of financial markets, trading principles, risk management, and decision-making frameworks. It should not be interpreted as personalised financial advice, investment advice, trading recommendations, portfolio management services, or a solicitation to buy or sell any financial instrument.
No Guarantee of Results
Financial markets involve uncertainty and risk.
Past performance, historical examples, case studies, illustrations, or trading frameworks discussed throughout this blueprint do not guarantee future performance or similar outcomes.
Every market participant may experience different results depending on capital, experience, risk tolerance, market conditions, discipline, and numerous other factors.
Trading and investing can result in partial or complete loss of capital.
Readers should participate only with capital they can reasonably afford to risk.
Personal Responsibility
Every trading and investment decision remains the sole responsibility of the individual reader.
Before acting on any concept discussed in this blueprint, readers should conduct their own independent research, exercise their own judgement, and where appropriate, consult a qualified financial adviser, tax professional, or other licensed professional relevant to their personal circumstances.
Neither the author nor TradKlear accepts responsibility for financial decisions made solely on the basis of the information presented in this publication.
Illustrations and Examples
Examples, charts, price levels, case studies, and trading illustrations included throughout this blueprint are presented solely to explain concepts and analytical frameworks.
They should not be interpreted as recommendations to trade any specific security, derivative, index, commodity, currency, or other financial instrument.
Any references to market behaviour are intended to support learning rather than predict future price movement.
About TradKlear
TradKlear is an independent financial education and market research platform.
Its mission is to promote structured thinking, disciplined learning, responsible risk management, and independent decision-making among market participants.
TradKlear does not promise guaranteed returns, assured profits, or risk-free trading outcomes.
The objective of every educational resource published by TradKlear is to help readers develop their own analytical framework rather than depend permanently on someone else’s.
Final Note
Financial markets reward continuous learning, disciplined execution, and thoughtful risk management.
Readers are encouraged to treat this blueprint as an educational resource, continue developing their own understanding, and always exercise independent judgement before making financial decisions.
“TradKlear believes that the purpose of financial education is not to tell people what to think, but to help them think more clearly before making decisions of their own.”


